How-To Guides
- Creating a Database
- Upgrading to Major Version
- Installing and Updating an Extension
- Creating Manual Backups
- Restoring a Backup
- Identifying Slow Queries
- Detect and terminate long-running queries
- Preventing Full Disk Issues
- Checking Database Size and Related Issues
Creating a Database
ClickHouse is a high-performance columnar database designed for real-time analytical processing. It’s known for its blazing speed, horizontal scalability, and efficient use of disk I/O. Proper setup is essential for taking advantage of ClickHouse’s full capabilities, including fault tolerance, secure access, and high query performance. This guide walks through various ways to run and connect to ClickHouse: using the ClickHouse CLI (clickhouse-client), Docker containers, and command-line tools for scripting and automation. Best practices are highlighted throughout to ensure robust deployments.
Creating using clickhouse-client
The ClickHouse command-line interface (clickhouse-client) is a built-in tool used to connect to and manage ClickHouse servers. It supports both local and remote connections and allows for SQL-based interaction with the database engine.
Connect to ClickHouse:
If you’re running ClickHouse locally (via package manager or Docker), you can start the CLI with:
clickhouse-clientFor remote connections, specify the hostname, port (default 9000), and user credentials:
clickhouse-client -h <host> --port <port> -u <username> --passwordOnce connected, you can run SQL queries directly from the shell.
Running ClickHouse Using Docker
Docker provides a fast, reproducible way to run ClickHouse in isolated environments. This is ideal for local development or self-contained production setups.
Access Elestio Terminal
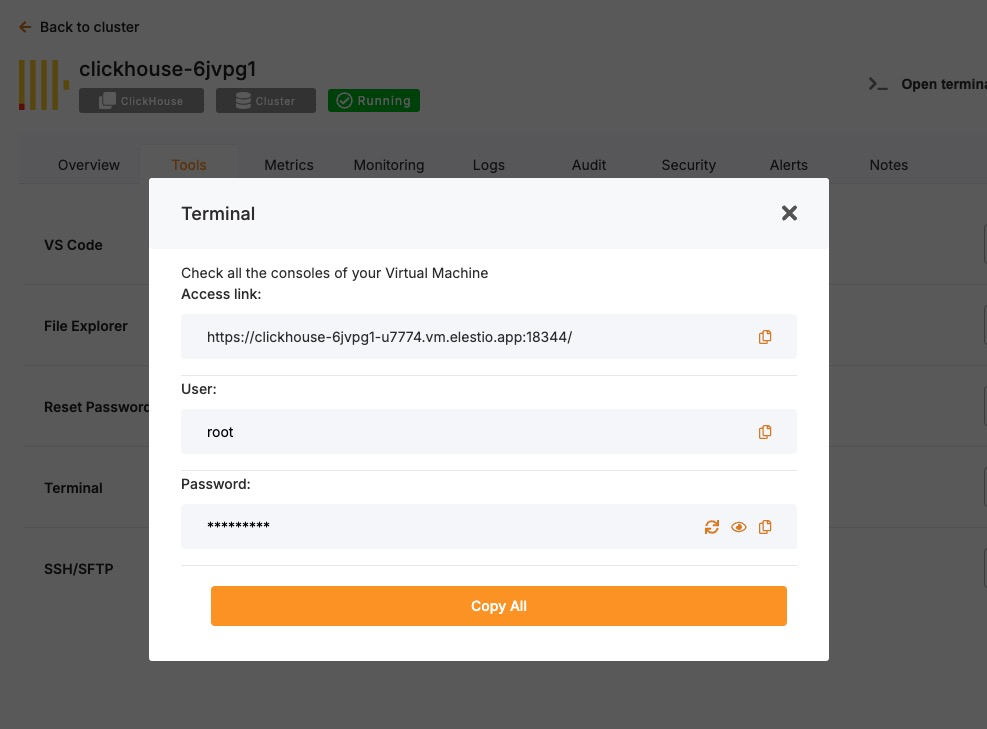
If you’re using Elestio for ClickHouse hosting, log into the Elestio dashboard. Go to your ClickHouse service, then navigate to Tools > Terminal to open a pre-authenticated shell session.
Now change the directory:
cd /opt/app/Access the ClickHouse Container Shell
Elestio-managed services run on Docker Compose. Use this to enter the ClickHouse container:
docker-compose exec clickhouse bashAccess ClickHouse CLI from Inside the Container
Once inside the container, the clickhouse-client tool is available. Run it like this (add --password if needed):
clickhouse-client -u <user> --port <port> --passwordYou are now connected to the running ClickHouse instance inside the container.
Test Connectivity
Try creating a database and querying data to verify functionality:
CREATE DATABASE test_db;
CREATE TABLE test_db.test_table (id UInt32, message String) ENGINE = MergeTree() ORDER BY id;
INSERT INTO test_db.test_table VALUES (1, 'Hello ClickHouse');
SELECT * FROM test_db.test_table;
Expected Output:
1 Hello ClickHouseThis confirms read/write operations and query functionality.
Connecting Using clickhouse-client in Scripts
clickhouse-client can be used non-interactively for scripting, automation, and cron-based jobs.
For example, to insert data from a shell script:
echo "INSERT INTO test_db.test_table VALUES (2, 'Automated')" | \
clickhouse-client -h <host> -u <user> --password
This is useful for automated ETL jobs, health checks, or backup pipelines.
Best Practices for Setting Up ClickHouse
Use Clear Naming for Databases and Tables
Adopt consistent naming conventions for databases, tables, and columns. Use lowercase, underscore-separated names like:
user_events_2024
product_sales_agg
This improves clarity in multi-schema environments and helps with automation and maintenance scripts.
Choose the Right Engine and Indexing Strategy
ClickHouse supports various table engines like MergeTree, ReplacingMergeTree, and SummingMergeTree. Pick the engine that best matches your use case and define ORDER BY keys carefully to optimize performance.
Example:
CREATE TABLE logs (
  timestamp DateTime,
  service String,
  message String
) ENGINE = MergeTree()
ORDER BY (timestamp, service);
Inappropriate engine selection can lead to poor query performance or high disk usage.
Enable Authentication and Secure Access
Always configure user-level authentication and restrict access in production. Add users and passwords in users.xml or via SQL:
CREATE USER secure_user IDENTIFIED WITH plaintext_password BY 'strong_password';
GRANT ALL ON *.* TO secure_user;
Use TLS for encrypted connections by enabling SSL in the config.xml file:
<tcp_port_secure>9440</tcp_port_secure>
<openSSL>
  <server>
    <certificateFile>/etc/clickhouse-server/certs/server.crt</certificateFile>
    <privateKeyFile>/etc/clickhouse-server/certs/server.key</privateKeyFile>
  </server>
</openSSL>
Configure Data Persistence and Storage Paths
ClickHouse stores data on disk by default, but ensure proper mounting, storage separation, and backup routines.
In config.xml:
<path>/var/lib/clickhouse/</path>
<tmp_path>/var/lib/clickhouse/tmp/</tmp_path>
<user_files_path>/var/lib/clickhouse/user_files/</user_files_path>
Use RAID, SSDs, or networked volumes depending on your availability and performance needs.
Monitor and Tune Performance
Use built-in introspection tools like:
SELECT * FROM system.metrics;
SELECT * FROM system.query_log ORDER BY event_time DESC LIMIT 10;
SELECT * FROM system.parts;
For real-time observability, integrate with Grafana, Prometheus, or use ClickHouse Keeper metrics.
Also review:
-
system.mutations for long-running mutation jobs
-
system.errors for crash/debug info
-
system.replication_queue for sync issues in replicated tables
Common Issues and Their Solutions
|
Issue |
Cause |
Solution |
|---|---|---|
|
Authentication failure |
Wrong password or no user set |
Double-check credentials; use --password flag |
|
Cannot connect to localhost |
Service not running or incorrect port |
Ensure ClickHouse is running and check the port |
|
SSL/TLS handshake failed |
Incorrect certificate paths or permissions |
Verify file locations in config.xml and restart service |
|
Queries are slow |
Poor ORDER BY design or unoptimized table engine |
Reevaluate schema design and use indexes effectively |
|
Data lost after restart |
Misconfigured data path or ephemeral container |
Ensure proper disk volume mounts and storage persistence |
Upgrading to Major Version
Upgrading a database service on Elestio can be done without creating a new instance or performing a full manual migration. Elestio provides a built-in option to change the database version directly from the dashboard. This is useful for cases where the upgrade does not involve breaking changes or when minimal manual involvement is preferred. The version upgrade process is handled by Elestio internally, including restarting the database service if required. This method reduces the number of steps involved and provides a way to keep services up to date with minimal configuration changes.
Log In and Locate Your Service
To begin the upgrade process, log in to your Elestio dashboard and navigate to the specific database service you want to upgrade. It is important to verify that the correct instance is selected, especially in environments where multiple databases are used for different purposes such as staging, testing, or production. The dashboard interface provides detailed information for each service, including version details, usage metrics, and current configuration. Ensure that you have access rights to perform upgrades on the selected service. Identifying the right instance helps avoid accidental changes to unrelated environments.
Back Up Your Data
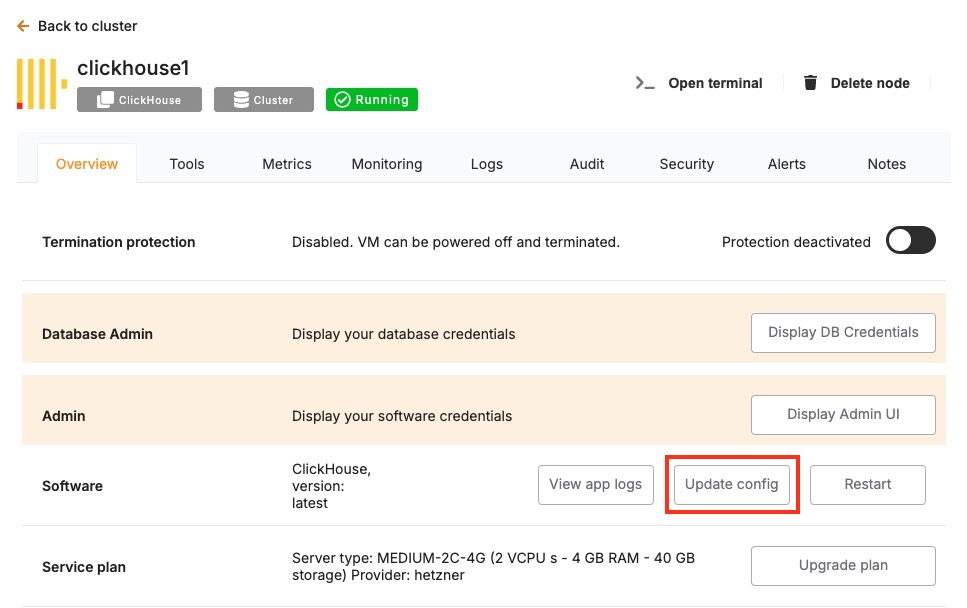
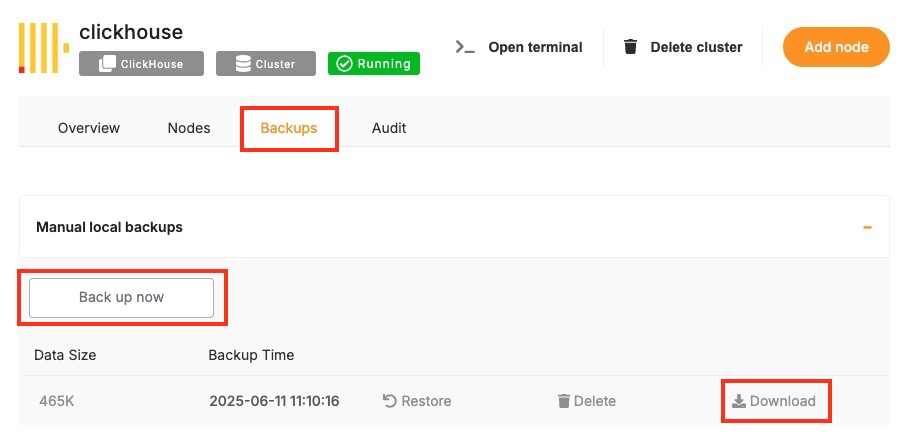
Before starting the upgrade, create a backup of your database. A backup stores the current state of your data, schema, indexes, and configuration, which can be restored if something goes wrong during the upgrade. In Elestio, this can be done through the Backups tab by selecting Back up now under Manual local backups and Download the backup file. Scheduled backups may also be used, but it is recommended to create a manual one just before the upgrade. Keeping a recent backup allows quick recovery in case of errors or rollback needs. This is especially important in production environments where data consistency is critical.

Select the New Version
Once your backup is secure, proceed to the Overview and then Software > Update config tab within your database service page.
Here, you'll find an option labeled ENV. In the ENV menu, change the desired database version to SOFTWARE_VERSION. After confirming the version, Elestio will begin the upgrade process automatically. During this time, the platform takes care of the version change and restarts the database if needed. No manual commands are required, and the system handles most of the operational aspects in the background.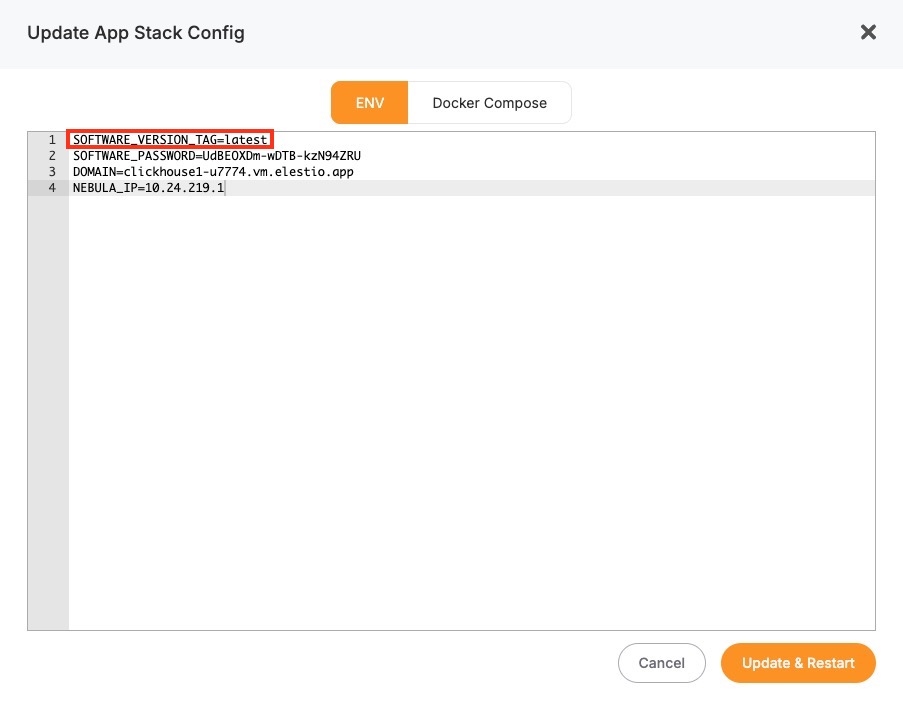
Monitor the Upgrade Process
The upgrade process may include a short downtime while the database restarts. Once it is completed, it is important to verify that the upgrade was successful and the service is operating as expected. Start by checking the logs available in the Elestio dashboard for any warnings or errors during the process. Then, review performance metrics to ensure the database is running normally and responding to queries. Finally, test the connection from your client applications to confirm that they can interact with the upgraded database without issues.
Installing and Updating an Extension
ClickHouse supports custom extensions via [User Defined Functions (UDFs)], external dictionaries, and shared libraries that extend its core capabilities with custom logic, formats, or integrations. These behave similarly to modules or plugins in other systems and must be configured at server startup. Common examples include integration with geospatial libraries, custom UDFs, or external dictionary sources like MySQL or HTTP.
In Elestio-hosted ClickHouse instances or any Docker Compose-based setup, extensions can be added by mounting external libraries or configuration files and referencing them in config.xml or users.xml. This guide walks through how to install, load, and manage ClickHouse extensions using Docker Compose along with best practices and common troubleshooting steps.
Installing and Enabling ClickHouse Extensions
ClickHouse extensions are typically compiled as shared objects (.so) files or defined as configuration files for dictionaries or formats. These files must be mounted into the container and referenced explicitly in the server’s configuration files.
Example: Load Custom Shared Library UDF
Suppose you have a compiled UDF called libexample_udf.so. To include it in a Docker Compose setup:
Update docker-compose.yml
services:
  clickhouse:
    image: clickhouse/clickhouse-server:latest
    volumes:
      - ./modules/libexample_udf.so:/usr/lib/clickhouse/user_defined/libexample_udf.so
      - ./configs/config.xml:/etc/clickhouse-server/config.xml
    ports:
      - "8123:8123"
- "9000:9000"-
./modules/libexample_udf.so: local path to the shared library on the host. -
/usr/lib/clickhouse/user_defined/: default directory for user libraries inside the container.
Make sure the file exists before running Docker Compose.
Configure config.xml to Load the UDF
In your custom config.xml:
<user_defined>
    <function>
        <name>example_udf</name>
        <type>udf</type>
        <library>libexample_udf.so</library>
    </function>
</user_defined>
The library path must match the volume mount location.
Restart the ClickHouse Service
After updating the Compose and configuration files, restart the service:
docker-compose down
docker-compose up -d
This will reload ClickHouse with the specified UDF.
Verify the Extension is Loaded
Connect using the ClickHouse CLI or HTTP interface and run:
SELECT example_udf('test input');If successful, the function will return expected results from the loaded library. You can also confirm the server loaded your shared library by inspecting logs:
docker-compose logs clickhouseLook for lines that indicate the library was found and loaded.
Managing External Dictionaries
ClickHouse supports loading external data sources (like MySQL, HTTP APIs, or files) as dictionaries
Mount Dictionary Configuration
In docker-compose.yml:
volumes:
  - ./configs/dictionaries/:/etc/clickhouse-server/dictionaries/
Reference in config.xml
<dictionaries_config>/etc/clickhouse-server/dictionaries/*.xml</dictionaries_config>Example dictionary file (mysql_dictionary.xml):
<dictionary>
  <name>mysql_dict</name>
  <source>
    <mysql>
      <host>mysql-host</host>
      <user>root</user>
      <password>password</password>
      <db>test</db>
      <table>cities</table>
    </mysql>
  </source>
  <layout><flat /></layout>
  <structure>
    <id>id</id>
    <attribute>
      <name>name</name>
      <type>String</type>
    </attribute>
  </structure>
</dictionary>
Use the dictionary in queries:
SELECT dictGetString('mysql_dict', 'name', toUInt64(42));Updating or Removing Extensions
ClickHouse doesn’t support unloading UDFs or dictionaries at runtime. To modify or remove an extension:
1. Stop the container:
docker-compose down2. Edit config files:
-
Replace or remove the <function> entry in config.xml or dictionary config.
-
Replace or remove the .so file if applicable.
3. Restart the container:
docker-compose up -dAlways test changes in staging before deploying to production.
Troubleshooting Common Extension Issues
|
Issue |
Cause |
Resolution |
|---|---|---|
|
ClickHouse fails to start |
Invalid config or missing .so file |
Run docker-compose logs clickhouse and fix missing files or XML syntax |
|
UDF not recognized |
Wrong library path or missing permissions |
Ensure volume mount is correct and file is executable inside container |
|
Dictionary not available |
Config file not found or misconfigured XML |
Double-check dictionaries_config and validate with SHOW DICTIONARIES |
|
Segmentation fault |
Invalid shared library or ABI mismatch |
Recompile UDF for correct platform, verify against installed ClickHouse version |
|
Query fails silently |
Dictionary or UDF not fully loaded |
Recheck server logs for errors during startup |
Security Considerations
ClickHouse extensions especially shared libraries run with the same privileges as the ClickHouse server. Be cautious:
-
Only load trusted .so files from verified sources.
-
Ensure clickhouse user has restricted permissions inside the container.
-
Never expose dictionary or UDF paths to writable directories from external systems.
Avoid using custom UDFs or dictionaries from unknown sources in production environments without a thorough code review.
Creating Manual Backups
Regular backups are essential when running a ClickHouse deployment, especially if you’re using it for persistent analytics or time-series data. While Elestio handles automated backups by default, you may want to create manual backups before configuration changes, retain a local archive, or test backup automation. This guide walks through multiple methods for creating ClickHouse backups on Elestio, including dashboard snapshots, command-line approaches, and Docker Compose-based setups. It also explains backup storage, retention, and automation using scheduled jobs.
Manual Service Backups on Elestio
If you’re using Elestio’s managed ClickHouse service, the simplest way to perform a full backup is directly through the Elestio dashboard. This creates a snapshot of your current ClickHouse dataset and stores it in Elestio’s infrastructure. These snapshots can be restored later from the same interface, which is helpful when making critical changes or testing recovery workflows.
To trigger a manual ClickHouse backup on Elestio:
-
Log in to the Elestio dashboard.
-
Navigate to your ClickHouse service or cluster.
-
Click the Backups tab in the service menu.
-
Choose Back up now to generate a manual snapshot.
This method is recommended for quick, reliable backups without needing to use the command line.
Manual Backups Using Docker Compose
If your ClickHouse instance is deployed via Docker Compose (as is common on Elestio-hosted environments), you can manually back up ClickHouse by either copying its internal storage files or using the native BACKUP SQL command (available in ClickHouse v21.12+). These approaches allow you to maintain control over backup logic and frequency.
Access Elestio Terminal
Go to your deployed ClickHouse service in the Elestio dashboard, navigate to Tools > Terminal, and log in using the credentials provided.
Locate the ClickHouse Container Directory
cd /opt/app/This is the working directory of your Docker Compose project, which contains the docker-compose.yml file.
Trigger a Backup (Using SQL)
If you’re using ClickHouse with backup support enabled, you can execute:
docker-compose exec clickhouse clickhouse-client --query="BACKUP DATABASE default TO Disk('/backups/backup_$(date +%F)')"This creates a full backup of the default database inside the container at /backups.
Copy Backup Files from the Container
Use docker cp to move the backup directory to your host system:
docker cp $(docker-compose ps -q clickhouse):/backups/backup_$(date +%F) ./clickhouse_backup_$(date +%F)This gives you a restorable backup snapshot for storage or future recovery.
Backup Storage & Retention Best Practices
After creating backups, it’s important to store them securely and manage retention properly. ClickHouse backups can grow large depending on the volume and compression of your data.
Guidelines to Follow:
-
Use clear naming: clickhouse_backup_2025_06_09
-
Store off-site or on cloud storage (e.g. AWS S3, Backblaze, encrypted storage)
-
Retain: 7 daily backups, 4 weekly backups, and 3–6 monthly backups
-
Automate old file cleanup with cron jobs or retention scripts
-
Optionally compress backups with tar, gzip, or xz to reduce space
Automating ClickHouse Backups (cron)
Manual backup commands can be scheduled using tools like cron on Linux-based systems. This allows you to regularly back up your database without needing to run commands manually. Automating the process also reduces the risk of forgetting backups and ensures more consistent retention.
Example: Daily Backup at 3 AM
Edit the crontab:
crontab -eAdd a job like:
0 3 * * * docker-compose -f /opt/app/docker-compose.yml exec clickhouse \
clickhouse-client --query="BACKUP DATABASE default TO Disk('/backups/backup_$(date +\%F)')" && \
docker cp $(docker-compose -f /opt/app/docker-compose.yml ps -q clickhouse):/backups/backup_$(date +\%F) /backups/clickhouse_backup_$(date +\%F)
Make sure /backups/ exists and is writable by the cron user.
You can also compress the file or upload to cloud storage in the same script:
tar -czf /backups/clickhouse_backup_$(date +\%F).tar.gz /backups/clickhouse_backup_$(date +\%F)
rclone copy /backups/clickhouse_backup_$(date +\%F).tar.gz remote:clickhouse-backups
Backup Format and Restore Notes
|
Format |
Description |
Restore Method |
|---|---|---|
|
|
SQL-based backup using BACKUP command |
Use RESTORE DATABASE from the same Disk location |
|
|
Filesystem snapshot of |
Stop ClickHouse, extract data back into the directory, then restart |
To restore from a backup:
-
Stop ClickHouse:
docker-compose down-
Restore via SQL:
docker-compose exec clickhouse clickhouse-client --query="RESTORE DATABASE default FROM Disk('/backups/backup_2025-06-09')"-
Or restore from file-based archive:
tar -xzf clickhouse_backup_2025-06-09.tar.gz -C /opt/app/data/clickhouse/
docker-compose up -d
Restoring a Backup
Restoring ClickHouse backups is essential for disaster recovery, staging environment duplication, or rolling back to a known state. Elestio supports backup restoration both through its web dashboard and manually through Docker Compose and command-line methods. This guide explains how to restore ClickHouse backups from SQL-based snapshots or file-based archives, covering both full and partial restore scenarios, and includes solutions for common restoration issues.
Restoring from a Backup via Terminal
This method applies when you have a backup created using ClickHouse’s native BACKUP command or a direct copy of the data directory. To restore the backup, you must stop the running ClickHouse container, replace the data files, and restart the container to load the restored dataset.
Stop the ClickHouse Container
Shut down the ClickHouse container cleanly to avoid issues with open file handles or inconsistent state:
docker-compose downReplace the Backup Files
If your backup was created using the native ClickHouse BACKUP command and saved to /backups/backup_2025_06_09, copy it into the appropriate path within the container or bind mount.
Example:
cp -r ./clickhouse_backup_2025_06_09 /opt/app/backups/backup_2025_06_09Make sure this path corresponds to the volumes specified in your docker-compose.yml. For example:
volumes:
  - ./backups:/backups
  - ./data:/var/lib/clickhouse
If you’re restoring from a tarball archive, extract it into the correct volume mount:
tar -xzf clickhouse_backup_2025_06_09.tar.gz -C /opt/app/data/Restart ClickHouse
Start the ClickHouse container again:
docker-compose up -dClickHouse will load the data either from the standard data directory or, if using the backup snapshot method, you can explicitly restore the database using SQL (next section).
Restoring via Docker Compose Terminal
If you’re using backups made with the SQL BACKUP command, ClickHouse also provides a built-in method to restore via the RESTORE command.
Copy the Backup Directory into the Container
docker cp ./clickhouse_backup_2025_06_09 $(docker-compose ps -q clickhouse):/backups/backup_2025_06_09Restore with ClickHouse SQL
Enter the container terminal:
docker-compose exec clickhouse bashThen run the restore command:
clickhouse-client --query="RESTORE DATABASE default FROM Disk('/backups/backup_2025_06_09')"This will restore the default database and its contents from the previously created backup directory.
Partial Restores in ClickHouse
ClickHouse supports more granular restore operations using SQL syntax. You can restore individual tables or databases if the backup was created using the native BACKUP command.
Restore a Single Table
clickhouse-client --query="RESTORE TABLE default.events FROM Disk('/backups/backup_2025_06_09')"This restores just the events table from the default database without affecting other tables.
Restore Specific Schemas or Data
You can also export and import CSV or TSV snapshots for partial data management:
clickhouse-client --query="SELECT * FROM default.events FORMAT CSV" > events.csv
clickhouse-client --query="INSERT INTO default.events FORMAT CSV" < events.csv
Common Errors & How to Fix Them
Restoring ClickHouse data can occasionally fail due to permission issues, path mismatches, unsupported formats, or version conflicts. Here are some frequent issues and their solutions.
1. ClickHouse Fails to Start After Restore
Error:
DB::Exception: Corrupted data part ...Cause: The backup directory is incomplete or corrupted, or the file was not extracted properly.
Resolution:
-
Re-verify that the backup files were copied completely.
-
Use tar -tzf to inspect archive contents before extracting.
-
Make sure you’re restoring on the same ClickHouse version that created the backup.
2. RESTORE Command Fails with Permission Denied
Error:
DB::Exception: Cannot read from backup: Permission deniedCause: The container cannot access the /backups/ directory due to permissions.
Resolution:
-
Ensure the backup directory is readable by the ClickHouse process.
-
Use chmod -R 755 /opt/app/backups/ to adjust permissions if needed.
3. Data Not Restored
Cause: The RESTORE command did not include the correct database/table name or no data existed in the backup path.
Resolution:
-
Use
clickhouse-client --query="SHOW DATABASES"to confirm no restore happened. -
Run ls /backups/backup_2025_06_09/ inside the container to verify backup contents.
4. Permission Denied When Copying Files
Error:
cp: cannot create regular file ‘/opt/app/data/’: Permission deniedResolution:
Ensure your terminal session or script has write access to the target directory. Use sudo if needed:
sudo cp -r ./clickhouse_backup_2025_06_09 /opt/app/data/Identifying Slow Queries
Slow queries can impact ClickHouse performance, especially under high load or with inefficient queries or schema design. Whether you’re using ClickHouse on Elestio via the dashboard, accessing it inside a Docker Compose container, or running CLI queries, ClickHouse offers built-in tools to detect, diagnose, and optimize performance bottlenecks. This guide explains how to capture slow queries using system tables, measure query latency, and improve performance through tuning and query optimization.
Inspecting Slow Queries from the Terminal
ClickHouse logs query profiling information by default, which you can access via system tables. This allows you to identify long-running or resource-intensive queries directly from SQL.
Connect to ClickHouse via Terminal
Use the ClickHouse client to connect to your instance:
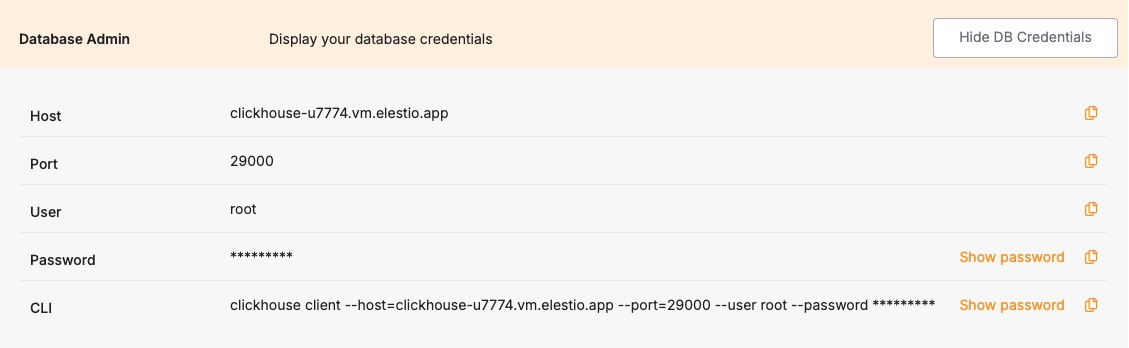
clickhouse-client -h <host> --port <port> --user <username> --password <password>Replace <host>, <port>, <username>, and <password> with your credentials from the Elestio dashboard.
View Recent Slow Queries
ClickHouse logs query performance stats in the system.query_log table. To view the 10 most recent queries that took longer than 1 second:
SELECT
  query_start_time,
  query_duration_ms,
  query
FROM system.query_log
WHERE type = 'QueryFinish'
  AND query_duration_ms > 1000
ORDER BY query_start_time DESC
LIMIT 10;
You can adjust the query_duration_ms threshold to capture slower or more critical queries.
Analyzing Inside Docker Compose
If your ClickHouse instance is running inside Docker Compose, you can inspect query logs and system performance from inside the container.
Access the ClickHouse Container
Open a shell session inside the running container:
docker-compose exec clickhouse bashThen run the ClickHouse client:
clickhouse-client --user rootIf a password is required, append --password <yourpassword> to the command.
Query the system.query_log Inside the Container
Run the same slow query inspection SQL as above to analyze performance issues:
SELECT query_start_time, query_duration_ms, query
FROM system.query_log
WHERE type = 'QueryFinish' AND query_duration_ms > 1000
ORDER BY query_start_time DESC
LIMIT 10;
Using the System Metrics & Events Tables
ClickHouse includes system tables that expose performance-related metrics in real time.
Check Overall Query Performance
You can use the system.metrics table to view metrics like query execution time, memory usage, and background operations:
SELECT *
FROM system.metrics
WHERE value != 0
ORDER BY value DESC;
For cumulative statistics like total queries processed, check the system.events table:
SELECT *
FROM system.events
WHERE value > 0
ORDER BY value DESC;
Understanding and Resolving Common Bottlenecks
Slow performance in ClickHouse is often caused by suboptimal queries, improper indexing (i.e., no primary key usage), disk I/O, or high memory usage.
Common Causes of Slow Queries:
-
Large table scans: Caused by missing filtering conditions or lack of primary key usage.
-
JOINs on unindexed keys: Inefficient joins can result in full-table scans.
-
High cardinality aggregations: Especially costly without optimization (e.g., using uniqExact()).
-
High insert latency: Triggered by too frequent small batch writes.
-
Disk bottlenecks: Heavy merges or large result sets can overload I/O.
Best Practices to Avoid Slow Queries:
-
Use appropriate filtering: Always filter with indexed columns (usually primary keys).
-
Avoid SELECT *: Specify only the needed columns.
-
Use sampling when possible: ClickHouse supports SAMPLE clause on MergeTree tables.
-
Use LIMIT: Avoid returning large result sets when debugging.
-
Optimize JOINs: Prefer ANY INNER JOIN or JOIN ... USING for performance.
Optimizing with Configuration Changes
ClickHouse performance can be tuned via its configuration files (config.xml and users.xml) or environment variables. For Docker Compose setups, these can be overridden via docker-compose.override.yml.
Adjust Query and Memory Settings Dynamically
Some performance-related settings can be changed per session or globally:
SET max_memory_usage = 2000000000;
SET max_threads = 4;
SET log_queries = 1;
To make permanent changes, modify your config.xml or users.xml inside the container volume mount.
Detect and terminate long-running queries
ClickHouse is a high-performance, column-oriented OLAP database, but poorly optimized or long-running queries can still impact performance especially in resource-constrained environments like Elestio. Because ClickHouse executes large queries across multiple threads and can consume high memory and disk I/O, monitoring and controlling slow or blocking operations is essential.
This guide explains how to detect, analyze, and terminate long-running queries using terminal tools, Docker Compose setups, and ClickHouse’s internal system tables. It also outlines prevention strategies to help maintain system health.
Monitoring Long-Running Queries
ClickHouse exposes query execution data through system tables like system.processes and system.query_log. These allow you to monitor currently executing and historical queries for duration, memory usage, and user activity.
Check Active Queries via Terminal
To list currently running queries and their duration:
SELECT
  query_id,
  user,
  elapsed,
  memory_usage,
  query
FROM system.processes
ORDER BY elapsed DESC;-
elapsed is the query runtime in seconds.
-
memory_usage is in bytes.
-
This lets you pinpoint queries that are taking too long or consuming excessive memory.
Monitor Query Load in Real Time
ClickHouse doesn’t have a MONITOR-like command, but you can simulate real-time monitoring by repeatedly querying system.processes:
watch -n 2 'clickhouse-client --query="SELECT elapsed, query FROM system.processes ORDER BY elapsed DESC LIMIT 5"'This updates every 2 seconds and shows the top 5 longest-running queries.
Terminating Problematic Queries Safely
If you identify a query that is consuming too many resources or blocking critical workloads, you can terminate it by its query_id.
Kill a Query by ID
KILL QUERY WHERE query_id = '<id>';-
The <id> can be found in the system.processes table.
-
This forces termination of the query while leaving the user session intact.
To forcibly kill all long-running queries (e.g., >60 seconds):
KILL QUERY WHERE elapsed > 60 SYNC;Use SYNC to wait for the termination to complete before proceeding.
Managing Inside Docker Compose
If ClickHouse is running inside Docker Compose on Elestio, follow these steps:
Access the ClickHouse Container
docker-compose exec clickhouse bashThen run:
clickhouse-client --user defaultIf authentication is enabled, add --password <your_password>.
You can now run queries like:
SELECT query_id, elapsed, query FROM system.processes;Or terminate:
KILL QUERY WHERE query_id = '<id>';Analyzing Query History
ClickHouse logs completed queries (including failures) in the system.query_log table.
View Historical Long-Running Queries
SELECT
  query_start_time,
  query_duration_ms,
  user,
  query
FROM system.query_log
WHERE type = 'QueryFinish'
  AND query_duration_ms > 1000
ORDER BY query_start_time DESC
LIMIT 10;
This helps identify patterns or repeat offenders.
Understanding Query Latency with Profiling Tools
ClickHouse provides advanced metrics via system.metrics, system.events, and system.asynchronous_metrics.
Generate a Performance Snapshot
SELECT * FROM system.metrics WHERE value != 0 ORDER BY value DESC;-
Use to analyze memory pressure, merge operations, disk reads/writes, and thread usage.
To examine detailed breakdowns of CPU usage or IO latency:
SELECT * FROM system.events WHERE value > 0 ORDER BY value DESC;Best Practices to Prevent Long-Running Queries
Preventing long-running queries is vital for maintaining ClickHouse performance, especially under high concurrency or on shared infrastructure.
- Avoid Full Table Scans: Use filters on primary key or indexed columns. Avoid queries without WHERE clauses on large tables.
SELECT count() FROM logs WHERE date >= '2024-01-01';- Limit Result Set Sizes: Avoid returning millions of rows to clients. Use LIMIT and paginated access.
SELECT * FROM logs ORDER BY timestamp DESC LIMIT 100;- Optimize Joins and Aggregations: Use ANY INNER JOIN for faster lookups. Avoid joining two huge datasets unless one is pre-aggregated or dimensionally small.
- Avoid High Cardinality Aggregates: Functions like uniqExact() are CPU-intensive. Prefer approximate variants (uniq()) when precision isn’t critical.
- Set Query Timeouts and Memory Limits: Limit resource usage per query:
SET max_execution_time = 30;
SET max_memory_usage = 1000000000;- Use Partitions and Projections: Partition large datasets by time (e.g., toYYYYMM(date)) to reduce scanned rows. Use projections for fast pre-aggregated access.
Preventing Full Disk Issues
Running out of disk space in a ClickHouse environment can cause query failures, part merge errors, and even full service downtime. ClickHouse is highly dependent on disk for storing columnar data, part files, metadata, temporary sort buffers, and backups. On platforms like Elestio, infrastructure is managed, but users are still responsible for monitoring storage, managing data retention, and optimizing resource usage. This guide explains how to monitor and clean up disk usage, configure safe retention policies, and implement long-term strategies to prevent full disk scenarios in ClickHouse when running under Docker Compose
Monitoring Disk Usage
Inspect the host system storage
Run this on the host machine to check which mount point is filling up:
df -hThis shows usage across all mounted volumes. Look for the mount used by your ClickHouse volume—usually mapped to something like /var/lib/docker/volumes/clickhouse_data/_data.
Check disk usage from inside the container
Enter the ClickHouse container shell:
docker-compose exec clickhouse bashInside, check total ClickHouse disk usage:
du -sh /var/lib/clickhouseTo inspect usage of specific folders like data/, tmp/, or store/:
ls -lh /var/lib/clickhouseConfiguring Alerts and Cleaning Up Storage
Inspect Docker’s storage usage
On the host, check space used by containers, images, volumes:
docker system dfIdentify and remove unused Docker volumes
List all Docker volumes:
docker volume lsRemove unused volumes (only if you’re sure they’re not needed):
docker volume rm <volume-name>Warning: Never delete your active ClickHouse data volume unless you’ve backed it up.
Drop data manually using SQL
To free space by removing outdated partitions or tables:
ALTER TABLE logs DROP PARTITION '2024-01';
TRUNCATE TABLE temp_events;
Clean up local backups
If you’re storing backups under /var/lib/clickhouse/backup, list and delete old ones:
ls -lh /var/lib/clickhouse/backup
rm -rf /var/lib/clickhouse/backup/backup-<timestamp>
Ensure important backups are offloaded before removing.
Managing Temporary Files
Monitor temporary file usage
Check the temp directory inside the container:
du -sh /var/lib/clickhouse/tmpOld files may remain if queries or merges crashed. Clean up when the system is idle.
Redirect temporary paths to persistent storage
Modify the tmp_path in config.xml to use a volume-backed directory:
<tmp_path>/var/lib/clickhouse/tmp/</tmp_path>Restart the container after applying changes.
Best Practices for Disk Space Management
-
Avoid storing binary blobs: Do not store large files like PDFs or images in ClickHouse. Use external object storage and only store references.
-
Use TTL to expire old data: Automatically delete old data based on timestamps:
ALTER TABLE logs MODIFY TTL created_at + INTERVAL 90 DAY;-
Drop old partitions regularly: If partitioned by month/day, remove outdated partitions:
ALTER TABLE logs DROP PARTITION '2023-12';-
Enable efficient compression: Use ZSTD for better compression and lower disk usage:
CREATE TABLE logs (...) ENGINE = MergeTree() SETTINGS compression = 'ZSTD';-
Split large inserts into smaller batches: Avoid memory and disk spikes during large ingest operations.
-
Optimize background merge load: Tune merge concurrency and thresholds using:
<background_pool_size>8</background_pool_size>-
Limit disk spill during queries: Prevent massive temp usage during large operations:
<max_bytes_before_external_sort>500000000</max_bytes_before_external_sort>-
Rotate Docker logs: Prevent logs from filling up your disk using log rotation:
logging:
  driver: "json-file"
  options:
    max-size: "10m"
max-file: "3"-
Monitor disk usage from ClickHouse itself: Track table-level disk usage using system tables:
SELECT table, sum(bytes_on_disk) AS size FROM system.parts GROUP BY table ORDER BY size DESC;-
Offload backups to remote storage: Backups inside containers should be copied off-host. Use Elestio’s backup tool or mount a backup volume:
volumes:
  - /mnt/backups:/backups
Checking Database Size and Related Issues
As your ClickHouse data grows especially with large analytical workloads or high-ingestion pipelines it’s important to track how storage is being used. Unchecked growth can lead to full disks, failed inserts, increased merge times, and slower queries. While Elestio handles the infrastructure, ClickHouse storage optimization and cleanup remain your responsibility. This guide explains how to inspect disk usage, analyze table size, detect inefficiencies, and manage ClickHouse storage effectively under a Docker Compose setup.
Checking Table Size and Disk Usage
ClickHouse stores data in columnar parts on disk, organized by partitions and merges. You can inspect disk consumption using SQL queries and Docker commands.
Check total disk space used by ClickHouse
From the host machine:
docker system dfIdentify the Docker volume associated with ClickHouse, then check disk usage:
docker volume ls
sudo du -sh /var/lib/docker/volumes/<clickhouse_volume_name>/_data
Inspect space used per table
Connect to ClickHouse from the container:
docker-compose exec clickhouse clickhouse-clientRun:
SELECT
  database,
  table,
  formatReadableSize(sum(bytes_on_disk)) AS size_on_disk
FROM system.parts
WHERE active
GROUP BY database, table
ORDER BY sum(bytes_on_disk) DESC;
This shows total size used by each active table on disk.
View storage location inside container
ClickHouse typically writes data under /var/lib/clickhouse:
docker-compose exec clickhouse ls -lh /var/lib/clickhouse/storeThis contains all table parts and metadata. Review sizes and delete orphaned data if needed.
Detecting Bloat and Inefficiencies
ClickHouse can accumulate unnecessary disk usage due to unoptimized merges, redundant partitions, or abandoned tables.
Check for unmerged parts
A high number of unmerged parts can slow down queries and increase disk usage:
SELECT
  database,
  table,
  count() AS part_count
FROM system.parts
WHERE active
GROUP BY database, table
ORDER BY part_count DESC;
Tables with many small parts may need a manual merge trigger.
Detect inactive or outdated parts
Look for inactive parts still occupying disk:
SELECT
  name,
  active,
  remove_time
FROM system.parts
WHERE active = 0
LIMIT 50;
These parts are safe to delete if they’re old and not part of ongoing operations.
Analyze storage by partition
To pinpoint heavy partitions:
SELECT
  table,
  partition_id,
  formatReadableSize(sum(bytes_on_disk)) AS size
FROM system.parts
WHERE active
GROUP BY table, partition_id
ORDER BY sum(bytes_on_disk) DESC;
Large partitions can indicate hot data or poor partitioning strategy.
Optimizing and Reclaiming ClickHouse Storage
ClickHouse provides several tools to optimize disk usage and clear unnecessary files.
Drop old partitions manually
For time-series or event tables, drop outdated partitions:
ALTER TABLE logs DROP PARTITION '2023-12';Use partition pruning to maintain data freshness.
Optimize tables to force merges
To reduce part count and improve compression:
OPTIMIZE TABLE logs FINAL;Use FINAL sparingly it can be resource-intensive.
Clean up old tables or unused databases
Drop stale or abandoned tables:
DROP TABLE old_analytics;Drop entire databases if needed:
DROP DATABASE dev_test;Always ensure no production data is affected.
Managing and Optimizing Files on Disk
ClickHouse stores metadata, parts, WAL logs, and temp files under /var/lib/clickhouse. You should monitor this path inside the container and from the host.
Monitor disk from inside container
docker-compose exec clickhouse du -sh /var/lib/clickhouseTo drill down:
docker-compose exec clickhouse du -sh /var/lib/clickhouse/*Identify unexpectedly large directories like /store, /tmp, or /data.
Purge temporary files and logs
ClickHouse writes to /var/lib/clickhouse/tmp and /var/log/clickhouse-server/:
docker-compose exec clickhouse du -sh /var/lib/clickhouse/tmp
docker-compose exec clickhouse du -sh /var/log/clickhouse-server/
Clear if disk is nearing full. Rotate or truncate logs if necessary.
Clean WALs and outdated mutations
If mutations or insert queues are stuck:
SELECT * FROM system.mutations WHERE is_done = 0;Investigate and resolve the root cause. Consider restarting ClickHouse after clearing safe logs.
Best Practices for ClickHouse Storage Management
-
Use partitioning: Partition large tables by time (e.g., daily, monthly) to enable faster drops and better merge control.
-
Archive old data: Move cold data to object storage (S3, etc.) or external databases for long-term storage.
-
Avoid oversized inserts: Insert in smaller chunks to avoid bloating parts and reduce memory pressure during merges.
-
Rotate logs: If ClickHouse logs to file, configure log rotation:
logging:
  driver: "json-file"
  options:
    max-size: "10m"
max-file: "3"-
Use ZSTD compression: Prefer ZSTD over LZ4 for better compression ratio at the cost of slightly higher CPU.
-
Monitor merges and disk pressure: Use system.metrics and system.events to track merge performance, part counts, and disk usage trends.
-
Backup externally: Don’t store backups on the same disk. Use Elestio backup options to archive to remote or cloud storage.