# ClickHouse
# Overview
ClickHouse is an open-source columnar database management system designed for online analytical processing (OLAP). It enables fast processing of large volumes of data by storing data by columns instead of rows, making it highly efficient for analytical queries. ClickHouse excels at real-time analytics, complex aggregations, and high-throughput data ingestion, making it suitable for data warehousing and business intelligence applications.
**Key Features of ClickHouse:**
- **High Performance for OLAP:** Designed specifically for analytical workloads, ClickHouse delivers lightning-fast query performance on large datasets by utilizing vectorized query execution and data compression techniques.
- **Columnar Storage:** Stores data by columns rather than rows, reducing I/O operations and improving the efficiency of aggregation and filtering operations common in analytics workloads.
- **Scalability and Distributed Processing:** Supports horizontal scaling across multiple nodes with sharding and replication, enabling the system to handle petabytes of data while maintaining high availability and fault tolerance.
- **Real-Time Data Ingestion and Querying:** Capable of ingesting millions of rows per second and running complex queries with low latency, making it ideal for real-time dashboards and monitoring systems.
- **SQL Support:** Provides a rich SQL dialect with extensions for analytical use cases, including window functions, subqueries, joins, arrays, and nested data structures, allowing for expressive and powerful queries.
- **Data Compression:** Implements advanced compression algorithms (LZ4, ZSTD, etc.), significantly reducing disk usage and improving query performance by minimizing disk reads.
- **Fault Tolerance and Replication:** Ensures data reliability through built-in replication and automatic failover mechanisms. Data can be replicated across nodes to prevent loss and allow for uninterrupted service.
- **Extensibility:** Allows users to extend functionality with user-defined functions, external dictionaries, and integrations with external systems (e.g., Kafka, S3, HDFS).
- **Security and Access Control:** Includes role-based access control, user authentication, and TLS encryption to secure data access and communication.
- **Cross-Platform Support:** ClickHouse runs on major operating systems, including Linux, macOS, and FreeBSD, offering flexibility for various infrastructure environments.
These features make ClickHouse a preferred choice for organisations that require real-time analytics at scale, combining high performance, fault tolerance, and rich SQL support in a modern columnar database system.
# How to Connect
# Connecting with ClickHouse GUI
Tabix is a lightweight browser-based GUI for ClickHouse that lets you browse tables, write queries, and manage your ClickHouse instance using a preconfigured admin dashboard provided by Elestio.
### **Variables**
To connect using Tabix, you’ll need the following login credentials. When you deploy a ClickHouse service on Elestio, a Tabix dashboard is automatically created and configured for you. These credentials are available in the Elestio service overview page:
**Variable**
**Description**
**Purpose**
USER
Tabix login username
Identifies the user with access permission to Tabix GUI.
PASSWORD
Tabix login password
Authentication key for the USER to access the Tabix dashboard.
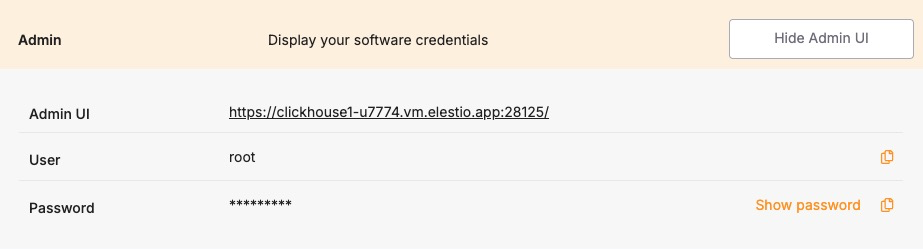
You can find these values in your Elestio project dashboard under the **Admin** section.
[](https://docs.elest.io/uploads/images/gallery/2025-06/lA0image.png)
### **Prerequisites**
Make sure the ClickHouse service is correctly deployed on Elestio and you are able to access the **Admin** section of the service overview page, which includes the Tabix dashboard URL and login credentials.
### **Setting Up the Connection**
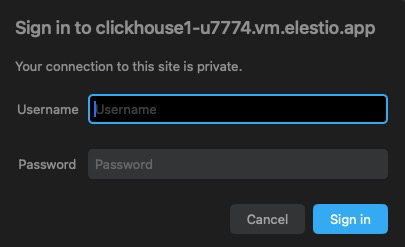
1. Launch Tabix from the **Admin UI URL** shown in your Elestio service.
2. Enter the provided **username** and **password**.
3. Click **Login**.
[](https://docs.elest.io/uploads/images/gallery/2025-06/eFsimage.png)
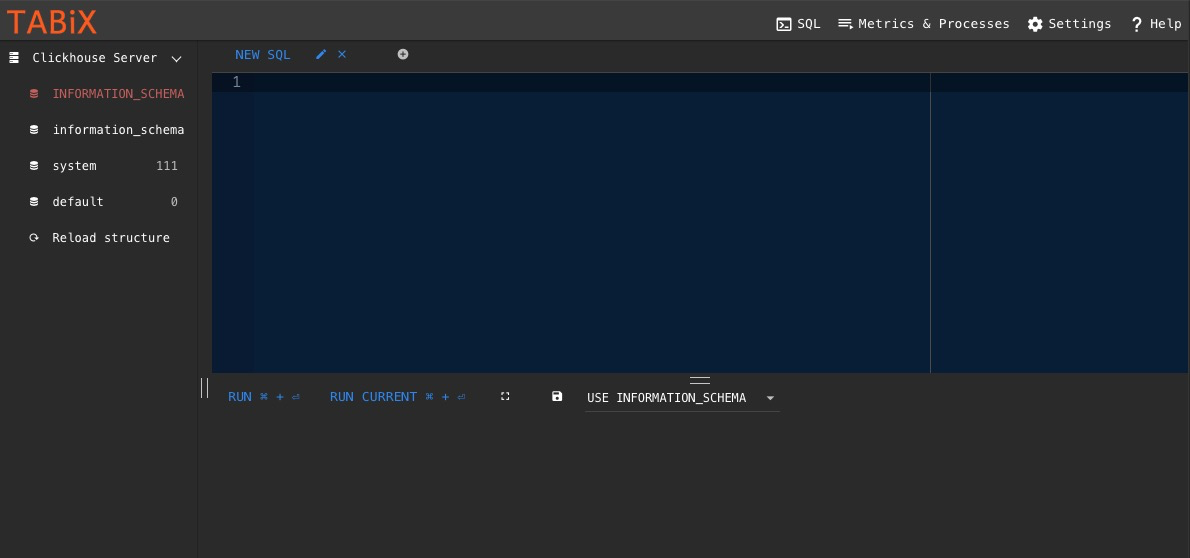
If the login is successful, Tabix will open directly into the SQL query interface where you can run queries, browse tables, and manage your ClickHouse schema and data.
[](https://docs.elest.io/uploads/images/gallery/2025-06/TT0image.png)
# How-To Guides
# Creating a Database
ClickHouse is a high-performance columnar database designed for real-time analytical processing. It’s known for its blazing speed, horizontal scalability, and efficient use of disk I/O. Proper setup is essential for taking advantage of ClickHouse’s full capabilities, including fault tolerance, secure access, and high query performance. This guide walks through various ways to run and connect to ClickHouse: using the ClickHouse CLI (clickhouse-client), Docker containers, and command-line tools for scripting and automation. Best practices are highlighted throughout to ensure robust deployments.
### **Creating using clickhouse-client**
The ClickHouse command-line interface (clickhouse-client) is a built-in tool used to connect to and manage ClickHouse servers. It supports both local and remote connections and allows for SQL-based interaction with the database engine.
#### **Connect to ClickHouse:**
If you’re running ClickHouse locally (via package manager or Docker), you can start the CLI with:
```
clickhouse-client
```
For remote connections, specify the hostname, port (default 9000), and user credentials:
```
clickhouse-client -h --port -u --password
```
Once connected, you can run SQL queries directly from the shell.
### **Running ClickHouse Using Docker**
Docker provides a fast, reproducible way to run ClickHouse in isolated environments. This is ideal for local development or self-contained production setups.
##### **Access Elestio Terminal**
If you’re using Elestio for ClickHouse hosting, log into the Elestio dashboard. Go to your ClickHouse service, then navigate to **Tools > Terminal** to open a pre-authenticated shell session.
[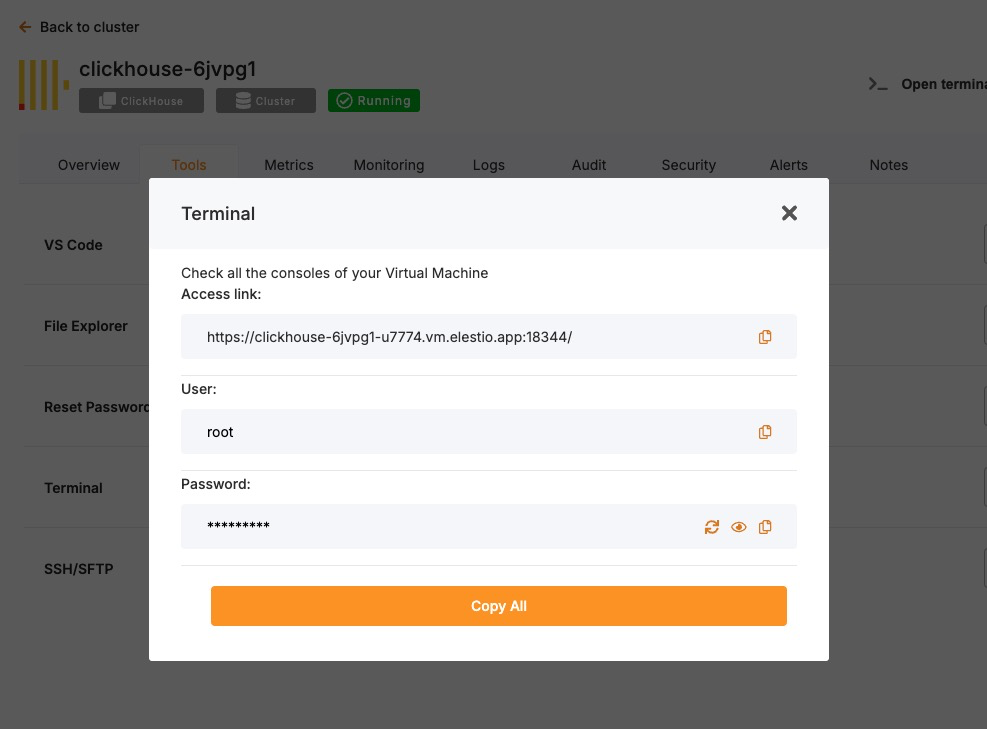](https://docs.elest.io/uploads/images/gallery/2025-06/Cntimage.png)
Now change the directory:
```
cd /opt/app/
```
##### **Access the ClickHouse Container Shell**
Elestio-managed services run on Docker Compose. Use this to enter the ClickHouse container:
```
docker-compose exec clickhouse bash
```
##### **Access ClickHouse CLI from Inside the Container**
Once inside the container, the clickhouse-client tool is available. Run it like this (add --password if needed):
```
clickhouse-client -u --port --password
```
You are now connected to the running ClickHouse instance inside the container.
##### **Test Connectivity**
Try creating a database and querying data to verify functionality:
```sql
CREATE DATABASE test_db;
CREATE TABLE test_db.test_table (id UInt32, message String) ENGINE = MergeTree() ORDER BY id;
INSERT INTO test_db.test_table VALUES (1, 'Hello ClickHouse');
SELECT * FROM test_db.test_table;
```
**Expected Output:**
```
1 Hello ClickHouse
```
This confirms read/write operations and query functionality.
### **Connecting Using clickhouse-client in Scripts**
clickhouse-client can be used non-interactively for scripting, automation, and cron-based jobs.
For example, to insert data from a shell script:
```
echo "INSERT INTO test_db.test_table VALUES (2, 'Automated')" | \
clickhouse-client -h -u --password
```
This is useful for automated ETL jobs, health checks, or backup pipelines.
## **Best Practices for Setting Up ClickHouse**
##### **Use Clear Naming for Databases and Tables**
Adopt consistent naming conventions for databases, tables, and columns. Use lowercase, underscore-separated names like:
```
user_events_2024
product_sales_agg
```
This improves clarity in multi-schema environments and helps with automation and maintenance scripts.
##### **Choose the Right Engine and Indexing Strategy**
ClickHouse supports various table engines like MergeTree, ReplacingMergeTree, and SummingMergeTree. Pick the engine that best matches your use case and define ORDER BY keys carefully to optimize performance.
Example:
```sql
CREATE TABLE logs (
timestamp DateTime,
service String,
message String
) ENGINE = MergeTree()
ORDER BY (timestamp, service);
```
Inappropriate engine selection can lead to poor query performance or high disk usage.
##### **Enable Authentication and Secure Access**
Always configure user-level authentication and restrict access in production. Add users and passwords in users.xml or via SQL:
```sql
CREATE USER secure_user IDENTIFIED WITH plaintext_password BY 'strong_password';
GRANT ALL ON *.* TO secure_user;
```
Use TLS for encrypted connections by enabling SSL in the config.xml file:
```xml
9440/etc/clickhouse-server/certs/server.crt/etc/clickhouse-server/certs/server.key
```
##### **Configure Data Persistence and Storage Paths**
ClickHouse stores data on disk by default, but ensure proper mounting, storage separation, and backup routines.
In config.xml:
```xml
/var/lib/clickhouse//var/lib/clickhouse/tmp//var/lib/clickhouse/user_files/
```
Use RAID, SSDs, or networked volumes depending on your availability and performance needs.
##### **Monitor and Tune Performance**
Use built-in introspection tools like:
```sql
SELECT * FROM system.metrics;
SELECT * FROM system.query_log ORDER BY event_time DESC LIMIT 10;
SELECT * FROM system.parts;
```
For real-time observability, integrate with Grafana, Prometheus, or use [ClickHouse Keeper metrics](https://clickhouse.com/docs/en/operations/monitoring/metrics/).
Also review:
- system.mutations for long-running mutation jobs
- system.errors for crash/debug info
- system.replication\_queue for sync issues in replicated tables
## **Common Issues and Their Solutions**
**Issue**
**Cause**
**Solution**
Authentication failure
Wrong password or no user set
Double-check credentials; use --password flag
Cannot connect to localhost
Service not running or incorrect port
Ensure ClickHouse is running and check the port
SSL/TLS handshake failed
Incorrect certificate paths or permissions
Verify file locations in config.xml and restart service
Queries are slow
Poor ORDER BY design or unoptimized table engine
Reevaluate schema design and use indexes effectively
Data lost after restart
Misconfigured data path or ephemeral container
Ensure proper disk volume mounts and storage persistence
# Upgrading to Major Version
Upgrading a database service on Elestio can be done without creating a new instance or performing a full manual migration. Elestio provides a built-in option to change the database version directly from the dashboard. This is useful for cases where the upgrade does not involve breaking changes or when minimal manual involvement is preferred. The version upgrade process is handled by Elestio internally, including restarting the database service if required. This method reduces the number of steps involved and provides a way to keep services up to date with minimal configuration changes.
### **Log In and Locate Your Service**
To begin the upgrade process, log in to your Elestio dashboard and navigate to the specific database service you want to upgrade. It is important to verify that the correct instance is selected, especially in environments where multiple databases are used for different purposes such as staging, testing, or production. The dashboard interface provides detailed information for each service, including version details, usage metrics, and current configuration. Ensure that you have access rights to perform upgrades on the selected service. Identifying the right instance helps avoid accidental changes to unrelated environments.
### **Back Up Your Data**
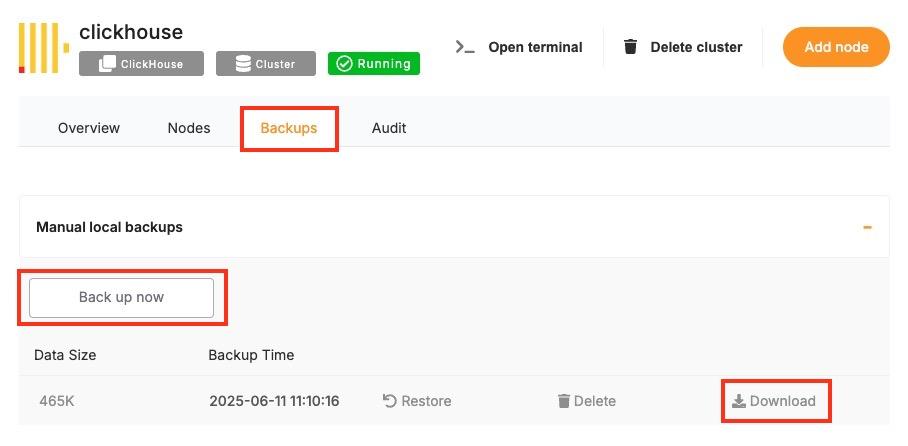
Before starting the upgrade, create a backup of your database. A backup stores the current state of your data, schema, indexes, and configuration, which can be restored if something goes wrong during the upgrade. In Elestio, this can be done through the **Backups** tab by selecting **Back up now** under Manual local backups and **Download** the backup file. Scheduled backups may also be used, but it is recommended to create a manual one just before the upgrade. Keeping a recent backup allows quick recovery in case of errors or rollback needs. This is especially important in production environments where data consistency is critical.
[](https://docs.elest.io/uploads/images/gallery/2025-06/screenshot-2025-06-11-at-11-10-38-am.jpg)
### **Select the New Version**
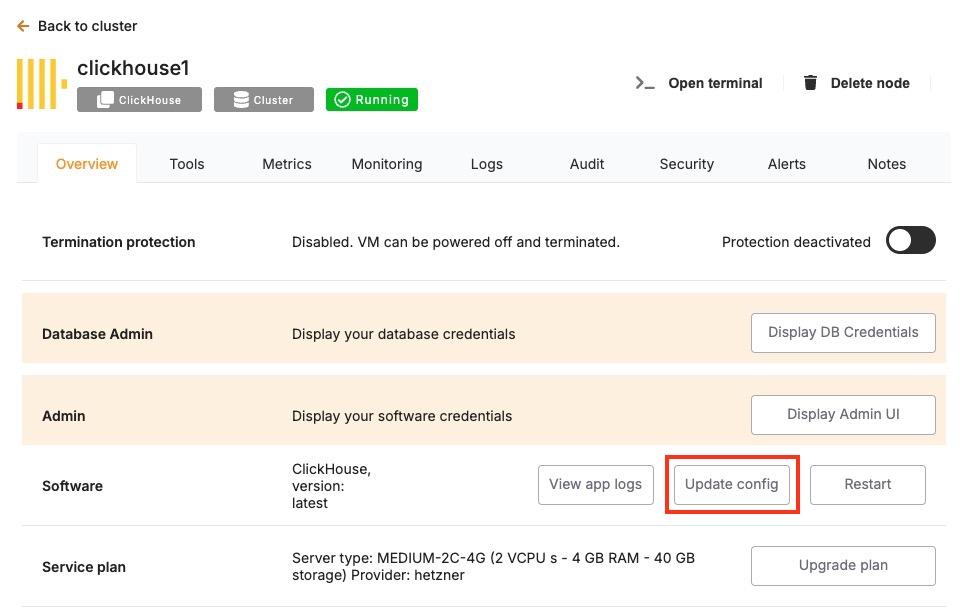
Once your backup is secure, proceed to the **Overview** and then **Software > Update config** tab within your database service page.
[](https://docs.elest.io/uploads/images/gallery/2025-06/screenshot-2025-06-11-at-11-12-02-am.jpg)
Here, you'll find an option labeled **ENV**. In the **ENV** menu, change the desired database version to `SOFTWARE_VERSION`. After confirming the version, Elestio will begin the upgrade process automatically. During this time, the platform takes care of the version change and restarts the database if needed. No manual commands are required, and the system handles most of the operational aspects in the background.[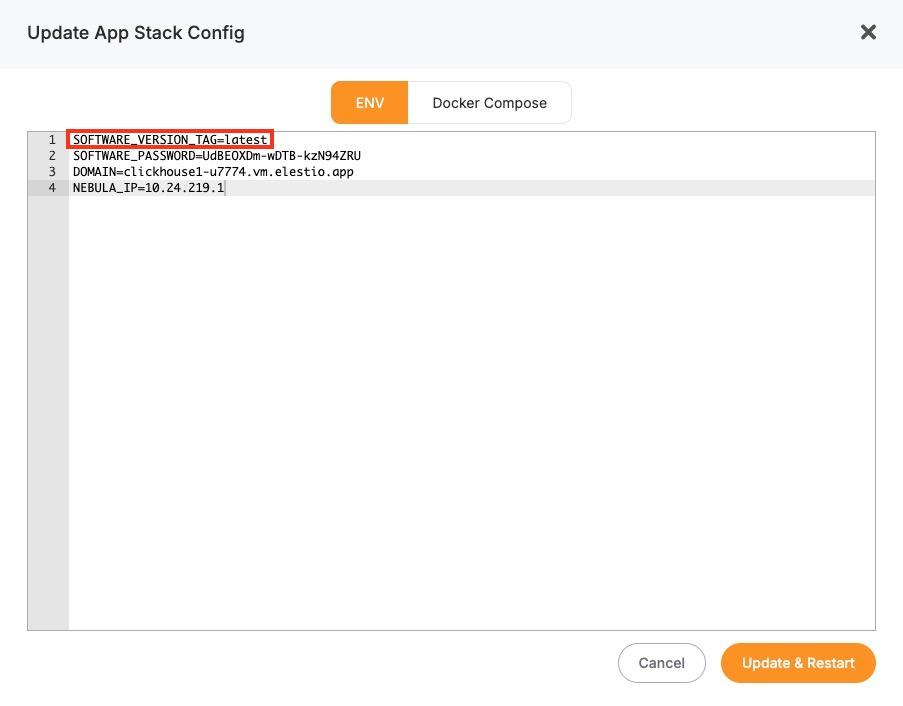](https://docs.elest.io/uploads/images/gallery/2025-06/screenshot-2025-06-11-at-11-12-50-am.jpg)
### **Monitor the Upgrade Process**
The upgrade process may include a short downtime while the database restarts. Once it is completed, it is important to verify that the upgrade was successful and the service is operating as expected. Start by checking the logs available in the Elestio dashboard for any warnings or errors during the process. Then, review performance metrics to ensure the database is running normally and responding to queries. Finally, test the connection from your client applications to confirm that they can interact with the upgraded database without issues.
# Installing and Updating an Extension
ClickHouse supports **custom extensions** via \[User Defined Functions (UDFs)\], external dictionaries, and shared libraries that extend its core capabilities with custom logic, formats, or integrations. These behave similarly to modules or plugins in other systems and must be configured at server startup. Common examples include integration with geospatial libraries, custom UDFs, or external dictionary sources like MySQL or HTTP.
In Elestio-hosted ClickHouse instances or any Docker Compose-based setup, extensions can be added by mounting external libraries or configuration files and referencing them in config.xml or users.xml. This guide walks through how to install, load, and manage ClickHouse extensions using Docker Compose along with best practices and common troubleshooting steps.
## **Installing and Enabling ClickHouse Extensions**
ClickHouse extensions are typically compiled as shared objects (.so) files or defined as configuration files for dictionaries or formats. These files must be mounted into the container and referenced explicitly in the server’s configuration files.
#### **Example: Load Custom Shared Library UDF**
Suppose you have a compiled UDF called `libexample_udf.so`. To include it in a Docker Compose setup:
##### **Update docker-compose.yml**
Mount the shared library into the container:
```yaml
services:
clickhouse:
image: clickhouse/clickhouse-server:latest
volumes:
- ./modules/libexample_udf.so:/usr/lib/clickhouse/user_defined/libexample_udf.so
- ./configs/config.xml:/etc/clickhouse-server/config.xml
ports:
- "8123:8123"
- "9000:9000"
```
- `./modules/libexample_udf.so`: local path to the shared library on the host.
- `/usr/lib/clickhouse/user_defined/`: default directory for user libraries inside the container.
Make sure the file exists before running Docker Compose.
##### **Configure config.xml to Load the UDF**
In your custom config.xml:
```xml
example_udfudflibexample_udf.so
```
> The library path must match the volume mount location.
##### **Restart the ClickHouse Service**
After updating the Compose and configuration files, restart the service:
```
docker-compose down
docker-compose up -d
```
This will reload ClickHouse with the specified UDF.
##### **Verify the Extension is Loaded**
Connect using the ClickHouse CLI or HTTP interface and run:
```
SELECT example_udf('test input');
```
If successful, the function will return expected results from the loaded library. You can also confirm the server loaded your shared library by inspecting logs:
```
docker-compose logs clickhouse
```
Look for lines that indicate the library was found and loaded.
## **Managing External Dictionaries**
ClickHouse supports loading external data sources (like MySQL, HTTP APIs, or files) as dictionaries
##### **Mount Dictionary Configuration**
In docker-compose.yml:
```
volumes:
- ./configs/dictionaries/:/etc/clickhouse-server/dictionaries/
```
##### **Reference in config.xml**
```xml
/etc/clickhouse-server/dictionaries/*.xml
```
Example dictionary file (mysql\_dictionary.xml):
```xml
mysql_dictmysql-hostrootpasswordtest
cities
idnameString
```
Use the dictionary in queries:
```
SELECT dictGetString('mysql_dict', 'name', toUInt64(42));
```
## **Updating or Removing Extensions**
ClickHouse doesn’t support unloading UDFs or dictionaries at runtime. To modify or remove an extension:
**1. Stop the container**:
```
docker-compose down
```
**2. Edit config files**:
- Replace or remove the <function> entry in config.xml or dictionary config.
- Replace or remove the .so file if applicable.
**3. Restart the container**:
```
docker-compose up -d
```
> Always test changes in staging before deploying to production.
## **Troubleshooting Common Extension Issues**
**Issue**
**Cause**
**Resolution**
ClickHouse fails to start
Invalid config or missing .so file
Run docker-compose logs clickhouse and fix missing files or XML syntax
UDF not recognized
Wrong library path or missing permissions
Ensure volume mount is correct and file is executable inside container
Dictionary not available
Config file not found or misconfigured XML
Double-check dictionaries\_config and validate with SHOW DICTIONARIES
Segmentation fault
Invalid shared library or ABI mismatch
Recompile UDF for correct platform, verify against installed ClickHouse version
Query fails silently
Dictionary or UDF not fully loaded
Recheck server logs for errors during startup
## **Security Considerations**
ClickHouse extensions especially shared libraries run with the same privileges as the ClickHouse server. Be cautious:
- Only load trusted .so files from verified sources.
- Ensure clickhouse user has restricted permissions inside the container.
- Never expose dictionary or UDF paths to writable directories from external systems.
Avoid using custom UDFs or dictionaries from unknown sources in production environments without a thorough code review.
# Creating Manual Backups
Regular backups are essential when running a ClickHouse deployment, especially if you’re using it for persistent analytics or time-series data. While Elestio handles automated backups by default, you may want to create manual backups before configuration changes, retain a local archive, or test backup automation. This guide walks through multiple methods for creating ClickHouse backups on Elestio, including dashboard snapshots, command-line approaches, and Docker Compose-based setups. It also explains backup storage, retention, and automation using scheduled jobs.
## **Manual Service Backups on Elestio**
If you’re using Elestio’s managed ClickHouse service, the simplest way to perform a full backup is directly through the Elestio dashboard. This creates a snapshot of your current ClickHouse dataset and stores it in Elestio’s infrastructure. These snapshots can be restored later from the same interface, which is helpful when making critical changes or testing recovery workflows.
To trigger a manual ClickHouse backup on Elestio:
- Log in to the Elestio dashboard.
- Navigate to your ClickHouse service or cluster.
- Click the **Backups** tab in the service menu.
- Choose **Back up now** to generate a manual snapshot.
[](https://docs.elest.io/uploads/images/gallery/2025-06/xU6screenshot-2025-06-11-at-11-10-38-am.jpg)
This method is recommended for quick, reliable backups without needing to use the command line.
## **Manual Backups Using Docker Compose**
If your ClickHouse instance is deployed via Docker Compose (as is common on Elestio-hosted environments), you can manually back up ClickHouse by either copying its internal storage files or using the native BACKUP SQL command (available in ClickHouse v21.12+). These approaches allow you to maintain control over backup logic and frequency.
#### **Access Elestio Terminal**
Go to your deployed ClickHouse service in the Elestio dashboard, navigate to **Tools > Terminal**, and log in using the credentials provided.
#### **Locate the ClickHouse Container Directory**
Navigate to your app directory:
```
cd /opt/app/
```
This is the working directory of your Docker Compose project, which contains the docker-compose.yml file.
#### **Trigger a Backup (Using SQL)**
If you’re using ClickHouse with backup support enabled, you can execute:
```
docker-compose exec clickhouse clickhouse-client --query="BACKUP DATABASE default TO Disk('/backups/backup_$(date +%F)')"
```
This creates a full backup of the default database inside the container at /backups.
#### **Copy Backup Files from the Container**
Use docker cp to move the backup directory to your host system:
```
docker cp $(docker-compose ps -q clickhouse):/backups/backup_$(date +%F) ./clickhouse_backup_$(date +%F)
```
This gives you a restorable backup snapshot for storage or future recovery.
## **Backup Storage & Retention Best Practices**
After creating backups, it’s important to store them securely and manage retention properly. ClickHouse backups can grow large depending on the volume and compression of your data.
#### **Guidelines to Follow:**
- Use clear naming: clickhouse\_backup\_2025\_06\_09
- Store off-site or on cloud storage (e.g. AWS S3, Backblaze, encrypted storage)
- Retain: 7 daily backups, 4 weekly backups, and 3–6 monthly backups
- Automate old file cleanup with cron jobs or retention scripts
- Optionally compress backups with tar, gzip, or xz to reduce space
## **Automating ClickHouse Backups (cron)**
Manual backup commands can be scheduled using tools like cron on Linux-based systems. This allows you to regularly back up your database without needing to run commands manually. Automating the process also reduces the risk of forgetting backups and ensures more consistent retention.
#### **Example: Daily Backup at 3 AM**
Edit the crontab:
```
crontab -e
```
Add a job like:
```
0 3 * * * docker-compose -f /opt/app/docker-compose.yml exec clickhouse \
clickhouse-client --query="BACKUP DATABASE default TO Disk('/backups/backup_$(date +\%F)')" && \
docker cp $(docker-compose -f /opt/app/docker-compose.yml ps -q clickhouse):/backups/backup_$(date +\%F) /backups/clickhouse_backup_$(date +\%F)
```
Make sure /backups/ exists and is writable by the cron user.
You can also compress the file or upload to cloud storage in the same script:
```
tar -czf /backups/clickhouse_backup_$(date +\%F).tar.gz /backups/clickhouse_backup_$(date +\%F)
rclone copy /backups/clickhouse_backup_$(date +\%F).tar.gz remote:clickhouse-backups
```
## **Backup Format and Restore Notes**
**Format**
**Description**
**Restore Method**
`/backups/backup_`
SQL-based backup using BACKUP command
Use RESTORE DATABASE from the same Disk location
`.tar.gz` or `.tar` archive
Filesystem snapshot of `/var/lib/clickhouse`
Stop ClickHouse, extract data back into the directory, then restart
#### **To restore from a backup:**
- **Stop ClickHouse**:
```
docker-compose down
```
- **Restore via SQL**:
```
docker-compose exec clickhouse clickhouse-client --query="RESTORE DATABASE default FROM Disk('/backups/backup_2025-06-09')"
```
- **Or restore from file-based archive**:
```
tar -xzf clickhouse_backup_2025-06-09.tar.gz -C /opt/app/data/clickhouse/
docker-compose up -d
```
# Restoring a Backup
Restoring ClickHouse backups is essential for disaster recovery, staging environment duplication, or rolling back to a known state. Elestio supports backup restoration both through its web dashboard and manually through Docker Compose and command-line methods. This guide explains how to restore ClickHouse backups from SQL-based snapshots or file-based archives, covering both full and partial restore scenarios, and includes solutions for common restoration issues.
## **Restoring from a Backup via Terminal**
This method applies when you have a backup created using ClickHouse’s native BACKUP command or a direct copy of the data directory. To restore the backup, you must stop the running ClickHouse container, replace the data files, and restart the container to load the restored dataset.
#### **Stop the ClickHouse Container**
Shut down the ClickHouse container cleanly to avoid issues with open file handles or inconsistent state:
```
docker-compose down
```
#### **Replace the Backup Files**
If your backup was created using the native ClickHouse BACKUP command and saved to /backups/backup\_2025\_06\_09, copy it into the appropriate path within the container or bind mount.
Example:
```
cp -r ./clickhouse_backup_2025_06_09 /opt/app/backups/backup_2025_06_09
```
Make sure this path corresponds to the volumes specified in your docker-compose.yml. For example:
```yaml
volumes:
- ./backups:/backups
- ./data:/var/lib/clickhouse
```
If you’re restoring from a tarball archive, extract it into the correct volume mount:
```
tar -xzf clickhouse_backup_2025_06_09.tar.gz -C /opt/app/data/
```
#### **Restart ClickHouse**
Start the ClickHouse container again:
```
docker-compose up -d
```
ClickHouse will load the data either from the standard data directory or, if using the backup snapshot method, you can explicitly restore the database using SQL (next section).
## **Restoring via Docker Compose Terminal**
If you’re using backups made with the SQL BACKUP command, ClickHouse also provides a built-in method to restore via the RESTORE command.
#### **Copy the Backup Directory into the Container**
```
docker cp ./clickhouse_backup_2025_06_09 $(docker-compose ps -q clickhouse):/backups/backup_2025_06_09
```
#### **Restore with ClickHouse SQL**
Enter the container terminal:
```
docker-compose exec clickhouse bash
```
Then run the restore command:
```
clickhouse-client --query="RESTORE DATABASE default FROM Disk('/backups/backup_2025_06_09')"
```
This will restore the default database and its contents from the previously created backup directory.
## **Partial Restores in ClickHouse**
ClickHouse supports more granular restore operations using SQL syntax. You can restore individual tables or databases if the backup was created using the native BACKUP command.
#### **Restore a Single Table**
```
clickhouse-client --query="RESTORE TABLE default.events FROM Disk('/backups/backup_2025_06_09')"
```
This restores just the events table from the default database without affecting other tables.
#### **Restore Specific Schemas or Data**
You can also export and import CSV or TSV snapshots for partial data management:
```
clickhouse-client --query="SELECT * FROM default.events FORMAT CSV" > events.csv
clickhouse-client --query="INSERT INTO default.events FORMAT CSV" < events.csv
```
## **Common Errors & How to Fix Them**
Restoring ClickHouse data can occasionally fail due to permission issues, path mismatches, unsupported formats, or version conflicts. Here are some frequent issues and their solutions.
#### **1. ClickHouse Fails to Start After Restore**
**Error:**
```
DB::Exception: Corrupted data part ...
```
**Cause:** The backup directory is incomplete or corrupted, or the file was not extracted properly.
**Resolution:**
- Re-verify that the backup files were copied completely.
- Use tar -tzf to inspect archive contents before extracting.
- Make sure you’re restoring on the same ClickHouse version that created the backup.
#### **2. RESTORE Command Fails with Permission Denied**
**Error:**
```
DB::Exception: Cannot read from backup: Permission denied
```
**Cause:** The container cannot access the /backups/ directory due to permissions.
**Resolution:**
- Ensure the backup directory is readable by the ClickHouse process.
- Use chmod -R 755 /opt/app/backups/ to adjust permissions if needed.
#### **3. Data Not Restored**
**Cause:** The RESTORE command did not include the correct database/table name or no data existed in the backup path.
**Resolution:**
- Use `clickhouse-client --query="SHOW DATABASES"` to confirm no restore happened.
- Run ls /backups/backup\_2025\_06\_09/ inside the container to verify backup contents.
#### **4. Permission Denied When Copying Files**
**Error:**
```
cp: cannot create regular file ‘/opt/app/data/’: Permission denied
```
**Resolution:**
Ensure your terminal session or script has write access to the target directory. Use sudo if needed:
```
sudo cp -r ./clickhouse_backup_2025_06_09 /opt/app/data/
```
# Identifying Slow Queries
Slow queries can impact ClickHouse performance, especially under high load or with inefficient queries or schema design. Whether you’re using ClickHouse on Elestio via the dashboard, accessing it inside a Docker Compose container, or running CLI queries, ClickHouse offers built-in tools to detect, diagnose, and optimize performance bottlenecks. This guide explains how to capture slow queries using system tables, measure query latency, and improve performance through tuning and query optimization.
### **Inspecting Slow Queries from the Terminal**
ClickHouse logs query profiling information by default, which you can access via system tables. This allows you to identify long-running or resource-intensive queries directly from SQL.
#### **Connect to ClickHouse via Terminal**
Use the ClickHouse client to connect to your instance:
```
clickhouse-client -h --port --user --password
```
Replace <host>, <port>, <username>, and <password> with your credentials from the Elestio dashboard.
[](https://docs.elest.io/uploads/images/gallery/2025-06/V4Ximage.png)
#### **View Recent Slow Queries**
ClickHouse logs query performance stats in the system.query\_log table. To view the 10 most recent queries that took longer than 1 second:
```sql
SELECT
query_start_time,
query_duration_ms,
query
FROM system.query_log
WHERE type = 'QueryFinish'
AND query_duration_ms > 1000
ORDER BY query_start_time DESC
LIMIT 10;
```
You can adjust the query\_duration\_ms threshold to capture slower or more critical queries.
### **Analyzing Inside Docker Compose**
If your ClickHouse instance is running inside Docker Compose, you can inspect query logs and system performance from inside the container.
#### **Access the ClickHouse Container**
Open a shell session inside the running container:
```
docker-compose exec clickhouse bash
```
Then run the ClickHouse client:
```
clickhouse-client --user root
```
If a password is required, append --password <yourpassword> to the command.
#### **Query the system.query\_log Inside the Container**
Run the same slow query inspection SQL as above to analyze performance issues:
```sql
SELECT query_start_time, query_duration_ms, query
FROM system.query_log
WHERE type = 'QueryFinish' AND query_duration_ms > 1000
ORDER BY query_start_time DESC
LIMIT 10;
```
### **Using the System Metrics & Events Tables**
ClickHouse includes system tables that expose performance-related metrics in real time.
#### **Check Overall Query Performance**
You can use the system.metrics table to view metrics like query execution time, memory usage, and background operations:
```sql
SELECT *
FROM system.metrics
WHERE value != 0
ORDER BY value DESC;
```
For cumulative statistics like total queries processed, check the system.events table:
```sql
SELECT *
FROM system.events
WHERE value > 0
ORDER BY value DESC;
```
### **Understanding and Resolving Common Bottlenecks**
Slow performance in ClickHouse is often caused by suboptimal queries, improper indexing (i.e., no primary key usage), disk I/O, or high memory usage.
#### **Common Causes of Slow Queries:**
- **Large table scans:** Caused by missing filtering conditions or lack of primary key usage.
- **JOINs on unindexed keys:** Inefficient joins can result in full-table scans.
- **High cardinality aggregations:** Especially costly without optimization (e.g., using uniqExact()).
- **High insert latency:** Triggered by too frequent small batch writes.
- **Disk bottlenecks:** Heavy merges or large result sets can overload I/O.
#### **Best Practices to Avoid Slow Queries:**
- **Use appropriate filtering:** Always filter with indexed columns (usually primary keys).
- **Avoid SELECT \*:** Specify only the needed columns.
- **Use sampling when possible:** ClickHouse supports SAMPLE clause on MergeTree tables.
- **Use LIMIT:** Avoid returning large result sets when debugging.
- **Optimize JOINs:** Prefer ANY INNER JOIN or JOIN ... USING for performance.
### **Optimizing with Configuration Changes**
ClickHouse performance can be tuned via its configuration files (config.xml and users.xml) or environment variables. For Docker Compose setups, these can be overridden via docker-compose.override.yml.
#### **Adjust Query and Memory Settings Dynamically**
Some performance-related settings can be changed per session or globally:
```sql
SET max_memory_usage = 2000000000;
SET max_threads = 4;
SET log_queries = 1;
```
To make permanent changes, modify your config.xml or users.xml inside the container volume mount.
# Detect and terminate long-running queries
ClickHouse is a high-performance, column-oriented OLAP database, but poorly optimized or long-running queries can still impact performance especially in resource-constrained environments like Elestio. Because ClickHouse executes large queries across multiple threads and can consume high memory and disk I/O, monitoring and controlling slow or blocking operations is essential.
This guide explains how to **detect**, **analyze**, and **terminate** long-running queries using terminal tools, Docker Compose setups, and ClickHouse’s internal system tables. It also outlines **prevention strategies** to help maintain system health.
## **Monitoring Long-Running Queries**
ClickHouse exposes query execution data through system tables like system.processes and system.query\_log. These allow you to monitor currently executing and historical queries for duration, memory usage, and user activity.
##### **Check Active Queries via Terminal**
To list currently running queries and their duration:
```sql
SELECT
query_id,
user,
elapsed,
memory_usage,
query
FROM system.processes
ORDER BY elapsed DESC;
```
- elapsed is the query runtime in seconds.
- memory\_usage is in bytes.
- This lets you pinpoint queries that are taking too long or consuming excessive memory.
##### **Monitor Query Load in Real Time**
ClickHouse doesn’t have a MONITOR-like command, but you can simulate real-time monitoring by repeatedly querying system.processes:
```
watch -n 2 'clickhouse-client --query="SELECT elapsed, query FROM system.processes ORDER BY elapsed DESC LIMIT 5"'
```
This updates every 2 seconds and shows the top 5 longest-running queries.
### **Terminating Problematic Queries Safely**
If you identify a query that is consuming too many resources or blocking critical workloads, you can terminate it by its query\_id.
##### **Kill a Query by ID**
```sql
KILL QUERY WHERE query_id = '';
```
- The <id> can be found in the system.processes table.
- This forces termination of the query while leaving the user session intact.
To forcibly kill all long-running queries (e.g., >60 seconds):
```sql
KILL QUERY WHERE elapsed > 60 SYNC;
```
> Use SYNC to wait for the termination to complete before proceeding.
### **Managing Inside Docker Compose**
If ClickHouse is running inside Docker Compose on Elestio, follow these steps:
##### **Access the ClickHouse Container**
```
docker-compose exec clickhouse bash
```
Then run:
```
clickhouse-client --user default
```
If authentication is enabled, add --password <your\_password>.
You can now run queries like:
```sql
SELECT query_id, elapsed, query FROM system.processes;
```
Or terminate:
```sql
KILL QUERY WHERE query_id = '';
```
## **Analyzing Query History**
ClickHouse logs completed queries (including failures) in the system.query\_log table.
##### **View Historical Long-Running Queries**
```sql
SELECT
query_start_time,
query_duration_ms,
user,
query
FROM system.query_log
WHERE type = 'QueryFinish'
AND query_duration_ms > 1000
ORDER BY query_start_time DESC
LIMIT 10;
```
This helps identify patterns or repeat offenders.
### **Understanding Query Latency with Profiling Tools**
ClickHouse provides advanced metrics via system.metrics, system.events, and system.asynchronous\_metrics.
##### **Generate a Performance Snapshot**
```sql
SELECT * FROM system.metrics WHERE value != 0 ORDER BY value DESC;
```
- Use to analyze memory pressure, merge operations, disk reads/writes, and thread usage.
To examine detailed breakdowns of CPU usage or IO latency:
```sql
SELECT * FROM system.events WHERE value > 0 ORDER BY value DESC;
```
### **Best Practices to Prevent Long-Running Queries**
Preventing long-running queries is vital for maintaining ClickHouse performance, especially under high concurrency or on shared infrastructure.
- **Avoid Full Table Scans:** Use filters on primary key or indexed columns. Avoid queries without WHERE clauses on large tables.
```sql
SELECT count() FROM logs WHERE date >= '2024-01-01';
```
- **Limit Result Set Sizes:** Avoid returning millions of rows to clients. Use LIMIT and paginated access.
```sql
SELECT * FROM logs ORDER BY timestamp DESC LIMIT 100;
```
- **Optimize Joins and Aggregations:** Use ANY INNER JOIN for faster lookups. Avoid joining two huge datasets unless one is pre-aggregated or dimensionally small.
- **Avoid High Cardinality Aggregates:** Functions like uniqExact() are CPU-intensive. Prefer approximate variants (uniq()) when precision isn’t critical.
- **Set Query Timeouts and Memory Limits:** Limit resource usage per query:
```sql
SET max_execution_time = 30;
SET max_memory_usage = 1000000000;
```
- **Use Partitions and Projections:** Partition large datasets by time (e.g., toYYYYMM(date)) to reduce scanned rows. Use projections for fast pre-aggregated access.
# Preventing Full Disk Issues
Running out of disk space in a ClickHouse environment can cause query failures, part merge errors, and even full service downtime. ClickHouse is highly dependent on disk for storing columnar data, part files, metadata, temporary sort buffers, and backups. On platforms like Elestio, infrastructure is managed, but users are still responsible for monitoring storage, managing data retention, and optimizing resource usage. This guide explains how to monitor and clean up disk usage, configure safe retention policies, and implement long-term strategies to prevent full disk scenarios in ClickHouse when running under Docker Compose
### **Monitoring Disk Usage**
#### **Inspect the host system storage**
Run this on the host machine to check which mount point is filling up:
```
df -h
```
This shows usage across all mounted volumes. Look for the mount used by your ClickHouse volume—usually mapped to something like /var/lib/docker/volumes/clickhouse\_data/\_data.
#### **Check disk usage from inside the container**
Enter the ClickHouse container shell:
```
docker-compose exec clickhouse bash
```
Inside, check total ClickHouse disk usage:
```
du -sh /var/lib/clickhouse
```
To inspect usage of specific folders like data/, tmp/, or store/:
```
ls -lh /var/lib/clickhouse
```
## **Configuring Alerts and Cleaning Up Storage**
#### **Inspect Docker’s storage usage**
On the host, check space used by containers, images, volumes:
```
docker system df
```
#### **Identify and remove unused Docker volumes**
List all Docker volumes:
```
docker volume ls
```
Remove unused volumes (only if you’re sure they’re not needed):
```
docker volume rm
```
> **Warning:** Never delete your active ClickHouse data volume unless you’ve backed it up.
#### **Drop data manually using SQL**
To free space by removing outdated partitions or tables:
```
ALTER TABLE logs DROP PARTITION '2024-01';
TRUNCATE TABLE temp_events;
```
#### **Clean up local backups**
If you’re storing backups under /var/lib/clickhouse/backup, list and delete old ones:
```
ls -lh /var/lib/clickhouse/backup
rm -rf /var/lib/clickhouse/backup/backup-
```
Ensure important backups are offloaded before removing.
### **Managing Temporary Files**
#### **Monitor temporary file usage**
Check the temp directory inside the container:
```
du -sh /var/lib/clickhouse/tmp
```
Old files may remain if queries or merges crashed. Clean up when the system is idle.
#### **Redirect temporary paths to persistent storage**
Modify the tmp\_path in config.xml to use a volume-backed directory:
```
/var/lib/clickhouse/tmp/
```
Restart the container after applying changes.
### **Best Practices for Disk Space Management**
- **Avoid storing binary blobs:** Do not store large files like PDFs or images in ClickHouse. Use external object storage and only store references.
- **Use TTL to expire old data:** Automatically delete old data based on timestamps:
```
ALTER TABLE logs MODIFY TTL created_at + INTERVAL 90 DAY;
```
- **Drop old partitions regularly:** If partitioned by month/day, remove outdated partitions:
```
ALTER TABLE logs DROP PARTITION '2023-12';
```
- **Enable efficient compression:** Use ZSTD for better compression and lower disk usage:
```
CREATE TABLE logs (...) ENGINE = MergeTree() SETTINGS compression = 'ZSTD';
```
- **Split large inserts into smaller batches:** Avoid memory and disk spikes during large ingest operations.
- **Optimize background merge load:** Tune merge concurrency and thresholds using:
```
8
```
- **Limit disk spill during queries:** Prevent massive temp usage during large operations:
```
500000000
```
- **Rotate Docker logs:** Prevent logs from filling up your disk using log rotation:
```yaml
logging:
driver: "json-file"
options:
max-size: "10m"
max-file: "3"
```
- **Monitor disk usage from ClickHouse itself:** Track table-level disk usage using system tables:
```
SELECT table, sum(bytes_on_disk) AS size FROM system.parts GROUP BY table ORDER BY size DESC;
```
- **Offload backups to remote storage:** Backups inside containers should be copied off-host. Use Elestio’s backup tool or mount a backup volume:
```
volumes:
- /mnt/backups:/backups
```
# Checking Database Size and Related Issues
As your ClickHouse data grows especially with large analytical workloads or high-ingestion pipelines it’s important to track how storage is being used. Unchecked growth can lead to full disks, failed inserts, increased merge times, and slower queries. While Elestio handles the infrastructure, ClickHouse storage optimization and cleanup remain your responsibility. This guide explains how to inspect disk usage, analyze table size, detect inefficiencies, and manage ClickHouse storage effectively under a Docker Compose setup.
### **Checking Table Size and Disk Usage**
ClickHouse stores data in columnar parts on disk, organized by partitions and merges. You can inspect disk consumption using SQL queries and Docker commands.
#### **Check total disk space used by ClickHouse**
From the host machine:
```
docker system df
```
Identify the Docker volume associated with ClickHouse, then check disk usage:
```
docker volume ls
sudo du -sh /var/lib/docker/volumes//_data
```
#### **Inspect space used per table**
Connect to ClickHouse from the container:
```
docker-compose exec clickhouse clickhouse-client
```
Run:
```sql
SELECT
database,
table,
formatReadableSize(sum(bytes_on_disk)) AS size_on_disk
FROM system.parts
WHERE active
GROUP BY database, table
ORDER BY sum(bytes_on_disk) DESC;
```
This shows total size used by each active table on disk.
#### **View storage location inside container**
ClickHouse typically writes data under /var/lib/clickhouse:
```
docker-compose exec clickhouse ls -lh /var/lib/clickhouse/store
```
This contains all table parts and metadata. Review sizes and delete orphaned data if needed.
### **Detecting Bloat and Inefficiencies**
ClickHouse can accumulate unnecessary disk usage due to unoptimized merges, redundant partitions, or abandoned tables.
#### **Check for unmerged parts**
A high number of unmerged parts can slow down queries and increase disk usage:
```sql
SELECT
database,
table,
count() AS part_count
FROM system.parts
WHERE active
GROUP BY database, table
ORDER BY part_count DESC;
```
Tables with many small parts may need a manual merge trigger.
#### **Detect inactive or outdated parts**
Look for inactive parts still occupying disk:
```sql
SELECT
name,
active,
remove_time
FROM system.parts
WHERE active = 0
LIMIT 50;
```
These parts are safe to delete if they’re old and not part of ongoing operations.
#### **Analyze storage by partition**
To pinpoint heavy partitions:
```sql
SELECT
table,
partition_id,
formatReadableSize(sum(bytes_on_disk)) AS size
FROM system.parts
WHERE active
GROUP BY table, partition_id
ORDER BY sum(bytes_on_disk) DESC;
```
Large partitions can indicate hot data or poor partitioning strategy.
### **Optimizing and Reclaiming ClickHouse Storage**
ClickHouse provides several tools to optimize disk usage and clear unnecessary files.
#### **Drop old partitions manually**
For time-series or event tables, drop outdated partitions:
```sql
ALTER TABLE logs DROP PARTITION '2023-12';
```
Use partition pruning to maintain data freshness.
#### **Optimize tables to force merges**
To reduce part count and improve compression:
```sql
OPTIMIZE TABLE logs FINAL;
```
Use FINAL sparingly it can be resource-intensive.
#### **Clean up old tables or unused databases**
Drop stale or abandoned tables:
```sql
DROP TABLE old_analytics;
```
Drop entire databases if needed:
```sql
DROP DATABASE dev_test;
```
Always ensure no production data is affected.
### **Managing and Optimizing Files on Disk**
ClickHouse stores metadata, parts, WAL logs, and temp files under /var/lib/clickhouse. You should monitor this path inside the container and from the host.
#### **Monitor disk from inside container**
```
docker-compose exec clickhouse du -sh /var/lib/clickhouse
```
To drill down:
```
docker-compose exec clickhouse du -sh /var/lib/clickhouse/*
```
Identify unexpectedly large directories like /store, /tmp, or /data.
#### **Purge temporary files and logs**
ClickHouse writes to /var/lib/clickhouse/tmp and /var/log/clickhouse-server/:
```
docker-compose exec clickhouse du -sh /var/lib/clickhouse/tmp
docker-compose exec clickhouse du -sh /var/log/clickhouse-server/
```
Clear if disk is nearing full. Rotate or truncate logs if necessary.
#### **Clean WALs and outdated mutations**
If mutations or insert queues are stuck:
```
SELECT * FROM system.mutations WHERE is_done = 0;
```
Investigate and resolve the root cause. Consider restarting ClickHouse after clearing safe logs.
### **Best Practices for ClickHouse Storage Management**
- Use partitioning: Partition large tables by time (e.g., daily, monthly) to enable faster drops and better merge control.
- Archive old data: Move cold data to object storage (S3, etc.) or external databases for long-term storage.
- Avoid oversized inserts: Insert in smaller chunks to avoid bloating parts and reduce memory pressure during merges.
- Rotate logs: If ClickHouse logs to file, configure log rotation:
```yaml
logging:
driver: "json-file"
options:
max-size: "10m"
max-file: "3"
```
- Use ZSTD compression: Prefer ZSTD over LZ4 for better compression ratio at the cost of slightly higher CPU.
- Monitor merges and disk pressure: Use system.metrics and system.events to track merge performance, part counts, and disk usage trends.
- Backup externally: Don’t store backups on the same disk. Use Elestio backup options to archive to remote or cloud storage.
# Database Migration
# Cloning a Service to Another Provider or Region
Migrating or cloning **ClickHouse** across cloud providers or geographic regions is essential for optimizing performance, meeting compliance requirements, or ensuring high availability. ClickHouse, being a distributed columnar OLAP database, introduces some unique considerations due to its architecture of shards and replicas. A well-planned migration ensures data consistency, system integrity, and minimal downtime.
### **Pre-Migration Preparation**
Before initiating a ClickHouse migration, it is critical to plan for both the data layout and cluster topology:
- **Evaluate the Current Setup:** Document the existing ClickHouse configuration, including cluster layout (shards and replicas), table schemas (especially ReplicatedMergeTree tables), user roles, ZooKeeper (or ClickHouse Keeper) setup, and storage configurations. Identify custom functions, dictionaries, and any external dependencies like Kafka or S3.
- **Define the Migration Target:** Choose the new region or cloud provider. Ensure the target environment supports similar storage and compute characteristics. Plan how the new cluster will be laid out—same shard/replica pattern or adjusted topology. If using cloud-native services (e.g., Elestio), verify feature parity.
- **Provision the Target Environment:** Deploy the ClickHouse nodes with required hardware specs (high IOPS disks, sufficient RAM/CPU). Set up coordination services (ZooKeeper or ClickHouse Keeper) and prepare the cluster topology in configuration files (remote\_servers.xml, zookeeper.xml, etc.).
- **Backup the Current Cluster:** Use ClickHouse’s built-in backup tools (BACKUP and RESTORE SQL commands, or clickhouse-backup utility) to create consistent snapshots. Ensure backups include both schema and data. Store backups on cloud-agnostic storage (e.g., S3) for ease of access during restoration.
### **Cloning Execution**
To begin cloning ClickHouse, replicate the original cluster’s configuration in the new environment, ensuring that the shard and replica layout, coordination services (ZooKeeper or ClickHouse Keeper), and access controls are all set up identically. This includes copying configuration files such as users.xml, remote\_servers.xml, and zookeeper.xml, and verifying that all inter-node communication is functional.
For table data, use ClickHouse’s native BACKUP and RESTORE SQL commands or the clickhouse-backup utility, ideally in combination with cloud object storage like S3 for efficient parallel upload and download. When restoring, ensure that ReplicatedMergeTree tables use new, unique ZooKeeper paths to avoid replication conflicts with the original cluster. In the case of non-replicated tables, manual data export and import (e.g., using INSERT SELECT or clickhouse-client --query) may be necessary.
After the data and schema have been restored, perform thorough validation by running sample queries, verifying performance against expected baselines, and inspecting logs for errors. Finally, ensure all integrations (e.g., Kafka pipelines, distributed tables, user-defined functions) are functional and fully consistent with the original service before proceeding to production traffic cutover.
### **Cutover and DNS/Traffic Switch**
Once the new ClickHouse cluster has been validated, you can proceed with the traffic cutover. Update your application’s client connection strings, service discovery endpoints, or load balancer configurations to direct requests to the new cluster. If you’re using DNS-based routing, update A or CNAME records accordingly, taking into account DNS propagation times.
For setups requiring high availability or a gradual transition, consider using weighted DNS records or a load balancer with health checks to route a portion of traffic to the new cluster while monitoring its performance. Ensure that all downstream applications, dashboards, and data pipelines are updated with the new endpoints and credentials. If feasible, maintain the old cluster temporarily as a fallback until the new environment is confirmed stable in production.
### **Post-Migration Validation and Optimization**
- **Validate Application Workflows:** Test analytics dashboards, queries, and data pipelines against the new cluster. Ensure integrations (e.g., Grafana, Kafka consumers, exporters) are fully functional.
- **Monitor Performance:** Use ClickHouse’s system.metrics and system.events tables to monitor performance. Validate disk space usage, query latency, and background merges. Adjust settings like max\_threads, merge\_max\_size, or background\_pool\_size for the new environment.
- **Secure the Environment:** Reapply user and role settings with secure password policies. Enable TLS for inter-node and client communications. Restrict access using firewalls, IP allowlists, and RBAC.
- **Cleanup and Documentation:** Decommission the old cluster only after full confidence in the new setup. Document changes in configuration, node addresses, backup schedules, and operational runbooks.
### **Benefits of Cloning ClickHouse**
Cloning a ClickHouse cluster provides several operational and strategic benefits. It allows teams to test version upgrades, schema changes, and application features on production-like data without impacting live systems. Maintaining a cloned cluster in a separate region or cloud provider also enables robust disaster recovery by providing a ready-to-promote standby.
For organizations with strict compliance or analytics needs, clones can serve as read-only environments for querying and reporting without risking the integrity of live data. Additionally, cloning simplifies cloud migrations by replicating the entire setup schema, configuration, and data into a new environment, thereby minimizing downtime, reducing manual setup, and accelerating cutover with high confidence.
# Database Migration Services for ClickHouse
Elestio provides a easy and reliable approach for migrating ClickHouse instances from various environments such as on-premises servers, self-managed cloud deployments, or other managed services into its fully managed ClickHouse platform. This migration process is designed to ensure data consistency, minimize downtime, and simplify the operational complexity of managing ClickHouse infrastructure.
### **Key Steps in Migrating to Elestio**
#### **Pre-Migration Preparation**
Before initiating your ClickHouse migration, proper preparation is essential to ensure a seamless and error-free transition:
- **Create an Elestio Account**: Sign up on the Elestio platform to access its suite of managed services. This account will serve as the central hub for provisioning and managing your ClickHouse instance.
- **Deploy the Target ClickHouse Service**: Create a new ClickHouse service on Elestio to act as the migration destination. Ensure that the version matches your current ClickHouse setup to prevent compatibility issues. Refer to Elestio’s ClickHouse documentation for supported features such as replication, sharding, merge trees, and compression settings.
#### **Initiating the Migration Process**
With the target environment ready, proceed with the ClickHouse migration using the Elestio migration interface:
- **Access the Migration Tool**: Navigate to your ClickHouse service overview on the Elestio dashboard. Select the “Migrate Database” option to begin the guided migration workflow.
- **Configure Migration Settings**: A prompt will appear to verify that the destination ClickHouse instance has sufficient CPU, RAM, and disk space to receive the source data. Once verified, click “Get started” to begin the migration.
- **Validate Source ClickHouse Connection**: Enter the connection details for your existing ClickHouse instance, including:
**Hostname** – IP address or domain of the source ClickHouse server
**Port** – Default ClickHouse port (9000 for native TCP, 8123 for HTTP)
**Username & Password** – Use credentials with read permissions on all target tables
**Database Name** – The specific ClickHouse database you wish to migrate
Click **“Run Check”** to validate connectivity. Elestio will confirm it can securely access and read from your ClickHouse instance.
[](https://docs.elest.io/uploads/images/gallery/2025-06/VFJimage.png)
- **Execute the Migration**: If all checks pass, click **“Start migration.”** Elestio will begin copying schema definitions, table structures, and all dataset partitions into the new ClickHouse environment. Depending on the dataset size and source performance, this process may take time. Real-time logs and progress indicators will be available to help track progress and address issues promptly.
### **Post-Migration Validation and Optimization**
Once the ClickHouse migration is complete, it’s critical to validate the deployment and ensure optimal performance:
- **Verify Data Consistency**: Use clickhouse-client or Elestio’s integrated terminal to compare row counts, table checksums, and sample queries between source and destination. Confirm that partitions, indexes, and materialized views are intact and functioning.
- **Test Application Connectivity**: Update your application’s ClickHouse connection settings to use the new host, port, and credentials provided by Elestio. Test query performance, batch insert operations, and any dependent pipelines or BI dashboards.
- **Optimize Performance**: Utilize Elestio’s dashboard to monitor CPU, disk IO, and query execution times. Adjust merge tree settings, buffer sizes, and caching parameters to suit your workload. You can also enable sharding or vertical scaling options as needed.
- **Implement Security Best Practices**: Secure your ClickHouse instance by configuring IP allowlists, rotating user credentials, and enabling TLS (if applicable). Elestio provides built-in access control and network isolation to reduce the risk of unauthorized access.
- **Clean Up and Document**: After successful validation, decommission the old ClickHouse environment if it’s no longer needed. Update internal documentation with new hostnames, credentials, cluster topology (if applicable), and any architectural changes made during migration.
### **Benefits of Using Elestio for ClickHouse**
Migrating ClickHouse to Elestio delivers several operational and strategic benefits:
- **Simplified Management**: Elestio handles routine ClickHouse operations like backups, software updates, storage provisioning, and cluster scaling. Its dashboard provides real-time performance insights, query logs, and system metrics all without needing a dedicated database administrator.
- **Security**: Elestio keeps ClickHouse up to date with the latest security patches and offers built-in credential management, IP allowlists, and encrypted connections. Scheduled backups and high-availability options ensure data safety and business continuity.
- **Performance**: Elestio’s infrastructure is tuned to support large-scale analytical workloads with minimal latency. It supports both single-node and clustered ClickHouse setups, providing flexibility for batch analytics, OLAP queries, and real-time data processing.
- **Scalability**: ClickHouse services on Elestio are built to grow with your needs. Users can scale up compute and storage, attach read replicas, or enable distributed clusters. Upgrades and reconfigurations are handled with minimal downtime, making scaling seamless.
# Manual ClickHouse Migration Using clickhouse-backup
Manual migrations using ClickHouse’s native tools, such as clickhouse-client, clickhouse-backup, and SQL dump files, are ideal for users who require full control over data export and import, particularly during transitions between providers, ClickHouse version upgrades, or importing existing self-managed ClickHouse datasets into Elestio’s managed environment. This guide walks through the process of performing a manual migration to and from Elestio ClickHouse services using command-line tools, ensuring data portability, consistency, and transparency at every step.
### **When to Use Manual Migration**
Manual migration using native ClickHouse tools is well-suited for scenarios that demand complete control over the migration process. It is especially useful when transferring data from a self-hosted ClickHouse instance, an on-premises server, or another cloud provider into Elestio’s managed ClickHouse service. This method supports one-time imports without requiring persistent connections between source and destination systems.
It also provides a reliable approach for performing version upgrades. Because ClickHouse allows full schema and data exports via SQL or compressed binary backups, it can restore into newer versions with minimal compatibility issues. When Elestio’s built-in migration tools are not applicable such as migrations from isolated environments or partial database exports manual migration becomes the preferred option. It also supports offline backup and archiving, enabling users to store, transport, and restore datasets independent of platform-specific tools.
### **Performing the Migration**
#### **Prepare the Environments**
Before starting the migration, ensure that ClickHouse is properly installed on both the source system and your Elestio service. The source ClickHouse server must allow access (if remote) and have a user with sufficient privileges to export databases, tables, and relevant partitions.
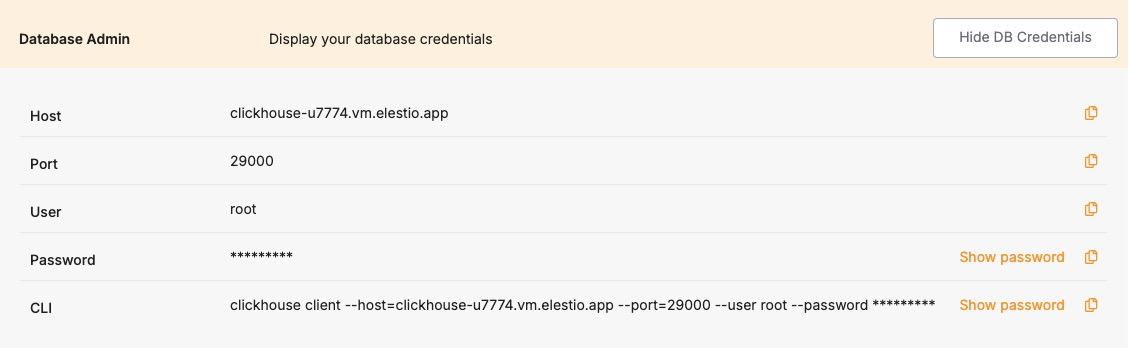
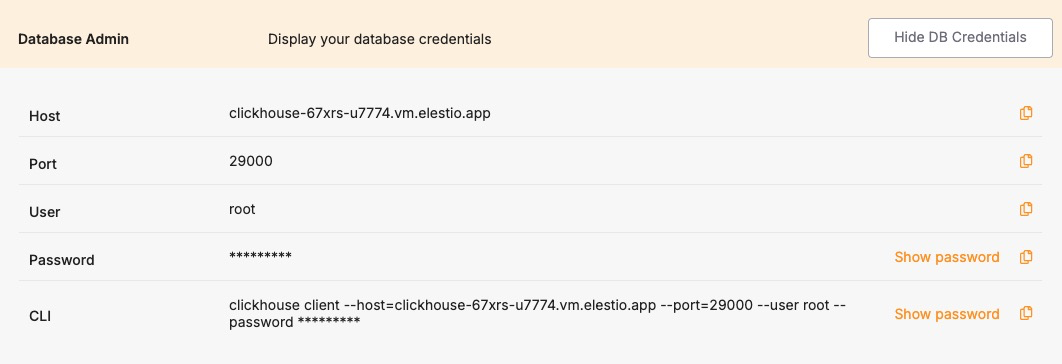
On the Elestio side, provision a ClickHouse service through the dashboard. Once active, retrieve the connection credentials from the Database Info section, which includes host, port (typically 9000 for TCP or 8123 for HTTP), username, and password. Confirm that your public IP is permitted under **Cluster Overview > Security > Limit access per IP** to ensure the ClickHouse port is reachable.
#### **Create a Backup Using ClickHouse Native Tools**
There are two primary methods to export a dataset from a ClickHouse instance:
**Option 1: SQL Dump**
To generate a schema and data dump, run:
```
clickhouse-client --host --query="SHOW CREATE TABLE .
" > schema.sql
clickhouse-client --host --query="SELECT * FROM .
FORMAT Native" > data.native
```
Repeat this process for all required tables.
**Option 2: Use clickhouse-backup**
Alternatively, use the clickhouse-backup tool to create compressed backups that include metadata and data:
```
clickhouse-backup create migration_snapshot
clickhouse-backup upload migration_snapshot
```
This tool can also store backups locally or push them to S3-compatible storage.
#### **Transfer the Backup to the Target**
Use a secure file transfer utility such as SCP to move exported files to the system that will connect to Elestio:
```
scp -r /path/to/backup user@host:/path/to/restore-system/
```
If using clickhouse-backup, copy the backup directory or the downloaded archive. These files will be restored into the Elestio-managed ClickHouse instance using the same tools or SQL replay.
#### **Restore the Dataset to Elestio**
To restore using SQL:
1. Recreate the schema:
```
clickhouse-client --host --port 9000 --user --password < schema.sql
```
2. Import the data:
```
clickhouse-client --host --port 9000 --user --password --query="INSERT INTO .
FORMAT Native" < data.native
```
If using clickhouse-backup, download the backup onto a local or remote machine with access to Elestio. Then:
```
clickhouse-backup restore migration_snapshot
```
Ensure the schema is created before restoring data, and verify that all necessary tables and partitions are populated.
#### **Validate the Migration**
After the migration, verify that your Elestio ClickHouse instance contains all expected data and performs correctly:
- **Check Row Count**
```
clickhouse-client --host --port 9000 --user --password --query="SELECT count() FROM .
"
```
- **List Tables**
```
clickhouse-client --host --port 9000 --user --password --query="SHOW TABLES FROM "
```
- **Query Sample Data**
Run queries to validate critical business metrics or analytical functions. Check that partitioning, primary keys, and indexes are preserved.
Finally, ensure that application connection strings have been updated to point to the new Elestio-hosted ClickHouse service and that dashboards, ingestion pipelines, or integrations function correctly.
### **Benefits of Manual Migration**
Manual ClickHouse migration using native tools and backup utilities offers several important advantages:
- **Portability and Compatibility**: Native ClickHouse formats (SQL, Native, backups) are open and can be restored into any compatible instance across VMs, containers, or cloud providers.
- **Version Flexibility**: Easily move between ClickHouse versions using exports that do not rely on replication or binary compatibility.
- **Offline Storage**: Backup files can be archived, versioned, and stored offline to support disaster recovery, compliance, and long-term retention.
- **Platform Independence**: Elestio supports open standards and does not enforce vendor lock-in. Migrations using native tools provide full control over schema design, data ownership, and performance tuning.
# Cluster Management
# Overview
Elestio provides a complete solution for setting up and managing software clusters. This helps users deploy, scale, and maintain applications more reliably. Clustering improves performance and ensures that services remain available, even if one part of the system fails. Elestio supports different cluster setups to handle various technical needs like load balancing, failover, and data replication.
#### **Supported Software for Clustering:**
Elestio supports clustering for a wide range of open-source software. Each is designed to support different use cases like databases, caching, and analytics:
- **MySQL**:
Supports Single Node, Primary/Replica, and Multi-Master cluster types. These allow users to create simple setups or more advanced ones where reads and writes are distributed across nodes. In a Primary/Replica setup, replicas are updated continuously through replication. These configurations are useful for high-traffic applications that need fast and reliable access to data.
- **PostgreSQL**:
PostgreSQL clusters can be configured for read scalability and failover protection. Replication ensures that data written to the primary node is copied to replicas. Clustering PostgreSQL also improves query throughput by offloading read queries to replicas. Elestio handles replication setup and node failover automatically.
- **Redis/KeyDB/Valkey**:
These in-memory data stores support clustering to improve speed and fault tolerance. Clustering divides data across multiple nodes (sharding), allowing horizontal scaling. These tools are commonly used for caching and real-time applications, so fast failover and data availability are critical.
- **Hydra and TimescaleDB**:
These support distributed and time-series workloads, respectively. Clustering helps manage large datasets spread across many nodes. TimescaleDB, built on PostgreSQL, benefits from clustering by distributing time-based data for fast querying. Hydra uses clustering to process identity and access management workloads more efficiently in high-load environments.
- **ClickHouse:**
ClickHouse supports distributed and replicated clustering modes, enabling high-performance analytics on large datasets. Clustering allows sharding across multiple nodes for horizontal scaling and replication for fault tolerance. This makes ClickHouse ideal for real-time dashboards, monitoring, and analytical workloads that require fast ingestion and low-latency queries. Elestio automates the setup of shards and replicas, making it easy to deploy robust ClickHouse clusters with minimal manual effort.
[](https://docs.elest.io/uploads/images/gallery/2025-06/image.png)
#### **Cluster Configurations:**
Elestio offers several clustering modes, each designed for a different balance between simplicity, speed, and reliability:
- **Single Node**:
This setup has only one node and is easy to manage. It acts as a standalone Primary node. It’s good for testing, development, or low-traffic applications. Later, you can scale to more nodes without rebuilding the entire setup. Elestio lets you expand this node into a full cluster with just a few clicks.
- **Primary/Replica**:
One node (Primary) handles all write operations, and one or more Replicas handle read queries. Replication is usually asynchronous and ensures data is copied to all replicas. This improves read performance and provides redundancy if the primary node fails. Elestio manages automatic data syncing and failover setup.
#### **Cluster Management Features:**
Elestio’s cluster dashboard includes tools for managing, monitoring, and securing your clusters. These help ensure stability and ease of use:
- **Node Management**:
You can scale your cluster by adding or removing nodes as your app grows. Adding a node increases capacity; removing one helps reduce costs. Elestio handles provisioning and configuring nodes automatically, including replication setup. This makes it easier to scale horizontally without downtime.
- **Backups and Restores**:
Elestio provides scheduled and on-demand backups for all nodes. Backups are stored securely and can be restored if something goes wrong. You can also create a snapshot before major changes to your system. This helps protect against data loss due to failures, bugs, or human error.
- **Access Control**:
You can limit access to your cluster using IP allowlists, ensuring only trusted sources can connect. Role-based access control (RBAC) can be applied for managing different user permissions. SSH and database passwords are generated securely and can be rotated easily from the dashboard. These access tools help reduce the risk of unauthorized access.
- **Monitoring and Alerts**:
Real-time metrics like CPU, memory, disk usage, and network traffic are available through the dashboard. You can also check logs for troubleshooting and set alerts for high resource usage or failure events. Elestio uses built-in observability tools to monitor the health of your cluster and notify you if something needs attention. This allows you to catch problems early and take action.
# Deploying a New Cluster
Creating a cluster is a foundational step when deploying services in Elestio. Clusters provide isolated environments where you can run containerized workloads, databases, and applications. Elestio’s web dashboard helps the process, allowing you to configure compute resources, choose cloud providers, and define deployment regions without writing infrastructure code. This guide walks through the steps required to create a new cluster using the Elestio dashboard.
## **Prerequisites**
To get started, you’ll need an active Elestio account. If you’re planning to use your own infrastructure, make sure you have valid credentials for your preferred cloud provider (like AWS, GCP, Azure, etc.). Alternatively, you can choose to deploy clusters using Elestio-managed infrastructure, which requires no external configuration.
## **Creating a Cluster**
Once you’re logged into the Elestio dashboard, navigate to the **Clusters** section from the sidebar. You’ll see an option to **Create a new cluster** clicking this will start the configuration process. The cluster creation flow is flexible but simple for defining essential details like provider, region, and resources in one place.
[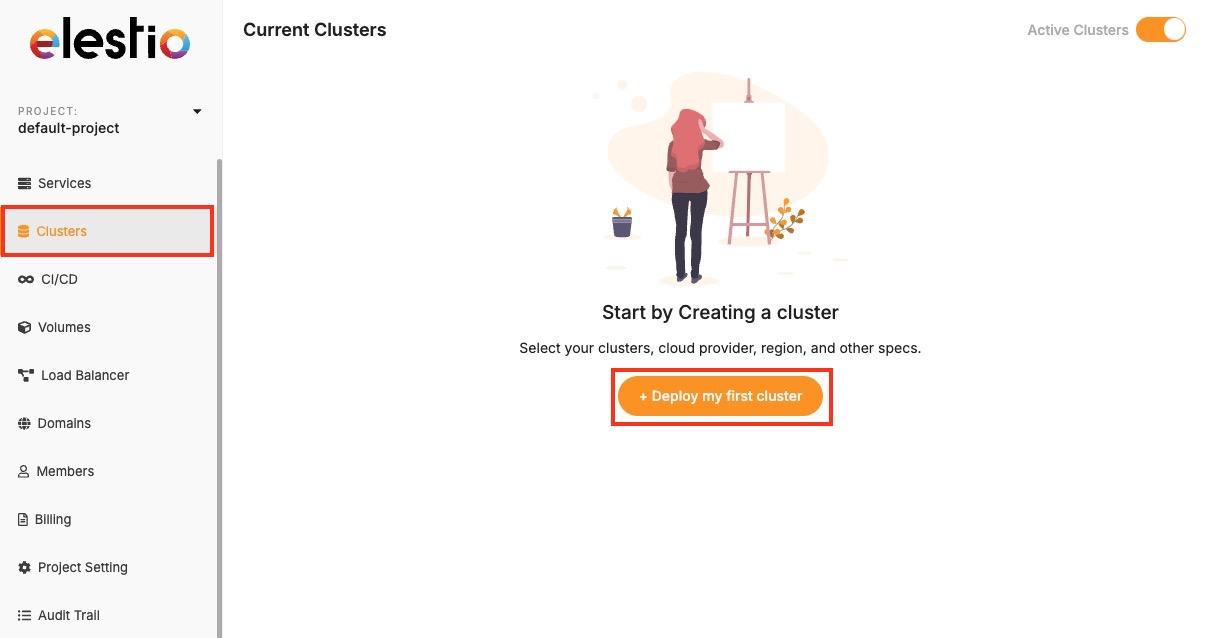](https://docs.elest.io/uploads/images/gallery/2025-04/screenshot-2025-04-23-at-2-09-00-pm.jpg)
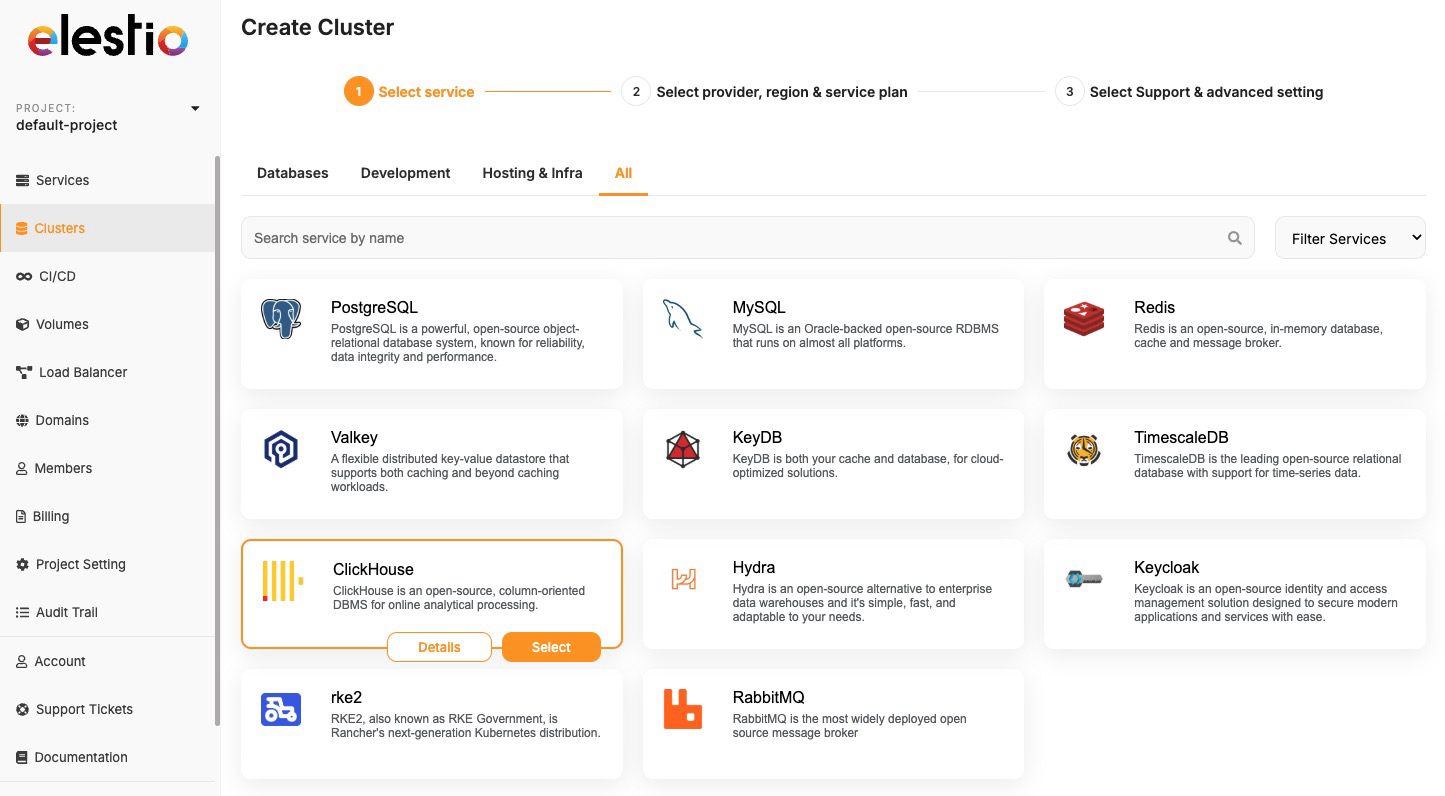
Now, select the database service of your choice that you need to create in a cluster environment. Click on **Select** button as you choose one.
[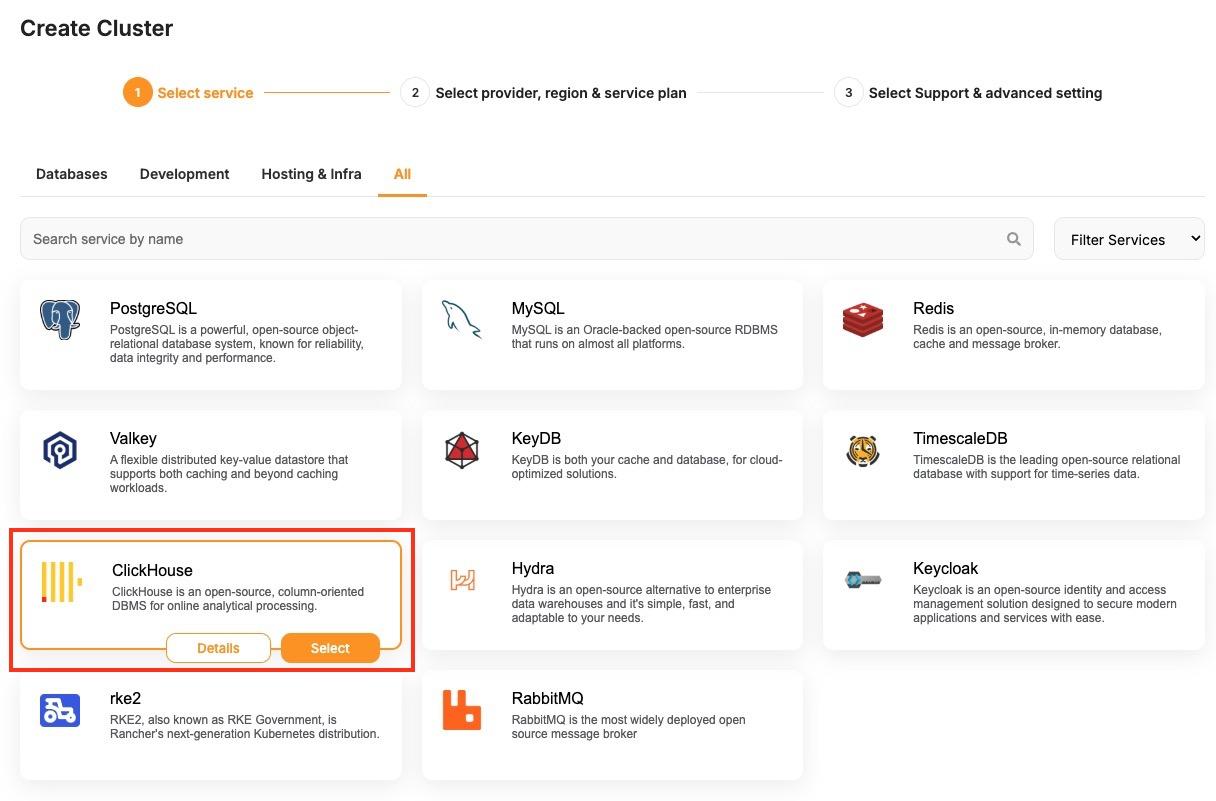](https://docs.elest.io/uploads/images/gallery/2025-06/screenshot-2025-06-09-at-1-00-18-pm.jpg)
During setup, you’ll be asked to choose a hosting provider. Elestio supports both managed and BYOC (Bring Your Own Cloud) deployments, including AWS, DigitalOcean, Hetzner, and custom configurations. You can then select a region based on latency or compliance needs, and specify the number of nodes along with CPU, RAM, and disk sizes per node.
[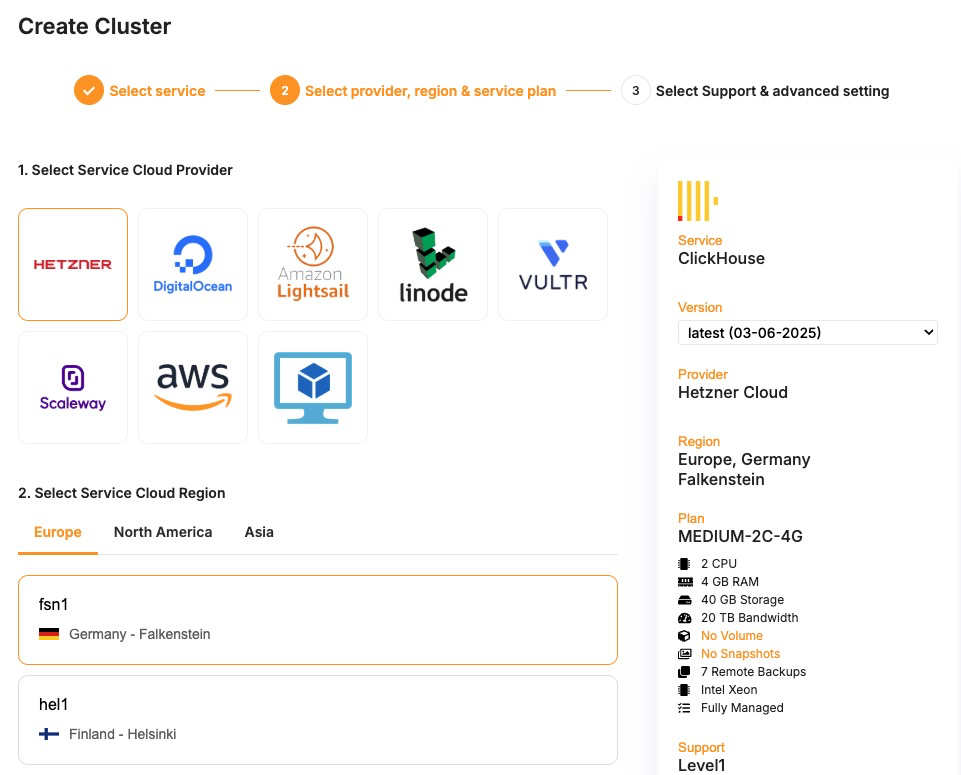](https://docs.elest.io/uploads/images/gallery/2025-06/KzGimage.png)
If you’re setting up a high-availability cluster, the dashboard also allows you to configure cluster-related details under **Cluster configuration,** where you get to select things like replication modes, number of replicas, etc. After you’ve configured the cluster, review the summary to ensure all settings are correct. Click the **Create Cluster** button to begin provisioning.
[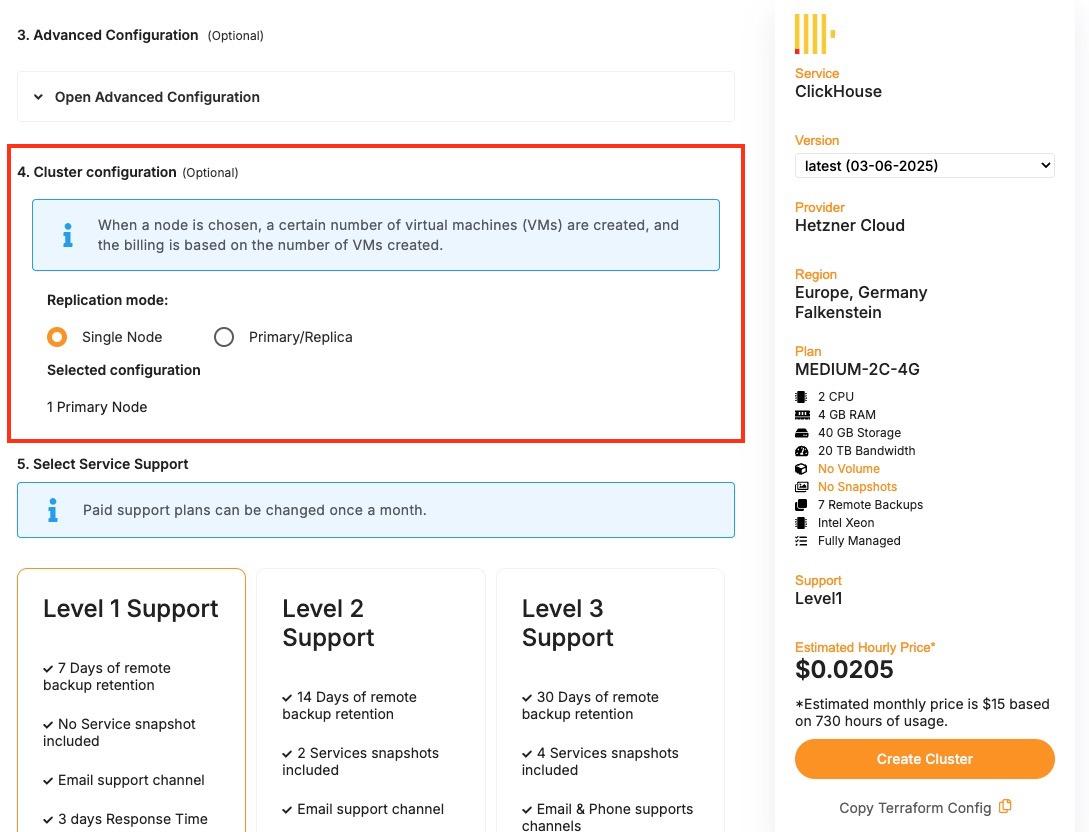](https://docs.elest.io/uploads/images/gallery/2025-06/screenshot-2025-06-09-at-1-02-29-pm.jpg)
Elestio will start the deployment process, and within a few minutes, the cluster will appear in your dashboard. Once your cluster is live, it can be used to deploy new nodes and additional configurations. Each cluster supports real-time monitoring, log access, and scaling operations through the dashboard. You can also set up automated backups and access control through built-in features available in the cluster settings.
# Node Management
Node management plays a critical role in operating reliable and scalable infrastructure on Elestio. Whether you’re deploying stateless applications or stateful services like databases, managing the underlying compute units nodes is essential for maintaining stability and performance.
## **Understanding Nodes**
In Elestio, a **node** is a virtual machine that contributes compute, memory, and storage resources to a cluster. Clusters can be composed of a single node or span multiple nodes, depending on workload demands and availability requirements. Each node runs essential services and containers as defined by your deployed applications or databases.
Nodes in Elestio are provider-agnostic, meaning the same concepts apply whether you’re using Elestio-managed infrastructure or connecting your own cloud provider (AWS, Azure, GCP, etc.). Each node is isolated at the VM level but participates fully in the cluster’s orchestration and networking. This abstraction allows you to manage infrastructure without diving into the complexity of underlying platforms.
## **Node Operations**
The Elestio dashboard allows you to manage the lifecycle of nodes through clearly defined operations. These include:
- **Creating a node**, which adds capacity to your cluster and helps with horizontal scaling of services. This is commonly used when load increases or when preparing a high-availability deployment.
- **Deleting a node**, which removes underutilized or problematic nodes. Safe deletion includes draining workloads to ensure service continuity.
- **Promoting a node**, which changes the role of a node within the cluster—typically used in clusters with redundancy, where certain nodes may need to take on primary or leader responsibilities.
Each of these operations is designed to be safely executed through the dashboard and is validated against the current cluster state to avoid unintended service disruption. These actions are supported by Elestio’s backend orchestration, which handles tasks like container rescheduling and load balancing when topology changes.
## **Monitoring and Maintenance**
Monitoring is a key part of effective node management. Elestio provides per-node visibility through the dashboard, allowing you to inspect **CPU**, **memory**, and **disk utilization** in real time. Each node also exposes **logs**, **status indicators**, and **health checks** to help detect anomalies or degradation early.
In addition to passive monitoring, the dashboard supports active maintenance tasks. You can **reboot a node** when applying system-level changes or troubleshooting, or **drain a node** to safely migrate workloads away from it before performing disruptive actions. Draining ensures that running containers are rescheduled on other nodes in the cluster, minimizing service impact.
For production setups, combining resource monitoring with automation like scheduled reboots, log collection, and alerting can help catch issues before they affect users. While Elestio handles many aspects of orchestration automatically, having visibility at the node level helps teams make informed decisions about scaling, updates, and incident response.
Cluster-wide resource graphs and node-level metrics are also useful for capacity planning. Identifying trends such as memory saturation or disk pressure allows you to preemptively scale or rebalance workloads, reducing the risk of downtime.
# Adding a Node
As your application usage grows or your infrastructure requirements change, scaling your cluster becomes essential. In Elestio, you can scale horizontally by adding new nodes to an existing cluster. This operation allows you to expand your compute capacity, improve availability, and distribute workloads more effectively.
## **Need to Add a Node**
There are several scenarios where adding a node becomes necessary. One of the most common cases is **resource saturation** when existing nodes are fully utilized in terms of CPU, memory, or disk. Adding another node helps distribute the workload and maintain performance under load.
In clusters that run **stateful services** or require **high availability**, having additional nodes ensures that workloads can fail over without downtime. Even in development environments, nodes can be added to isolate environments or test services under production-like load conditions. Scaling out also gives you flexibility when deploying services with different resource profiles or placement requirements.
## **Add a Node to Cluster**
To begin, log in to the [Elestio dashboard](https://dash.elest.io/) and navigate to the **Clusters** section from the sidebar. Select the cluster you want to scale. Once inside the cluster view, switch to the **Nodes** tab. This section provides an overview of all current nodes along with their health status and real-time resource usage.
[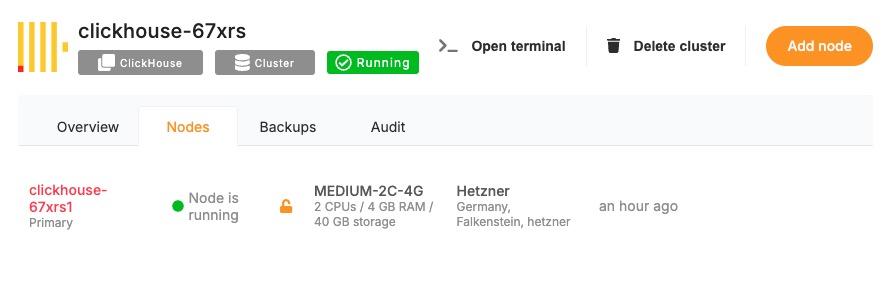](https://docs.elest.io/uploads/images/gallery/2025-06/screenshot-2025-06-09-at-1-05-37-pm.jpg)
To add a new node, click the **“Add Node”** button. This opens a configuration panel where you can define the specifications for the new node. You’ll be asked to specify the amount of **CPU**, **memory**, and **disk** you want to allocate. If you’re using a bring-your-own-cloud setup, you may also need to confirm or choose the cloud provider and deployment region.[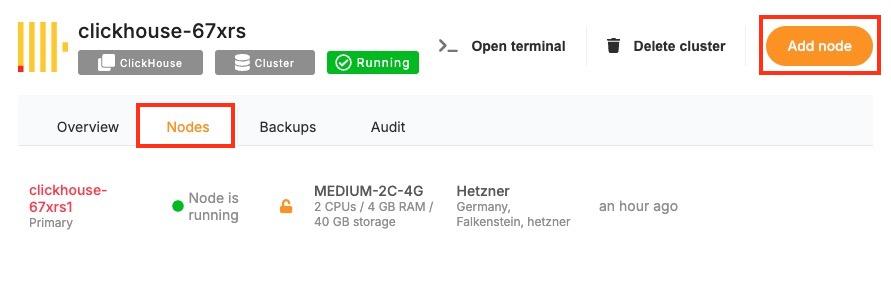](https://docs.elest.io/uploads/images/gallery/2025-06/azlscreenshot-2025-06-09-at-1-05-37-pm.jpg)
After configuring the node, review the settings to ensure they meet your performance and cost requirements. Click **“Create”** to initiate provisioning. Elestio will begin setting up the new node, and once it’s ready, it will automatically join your cluster.[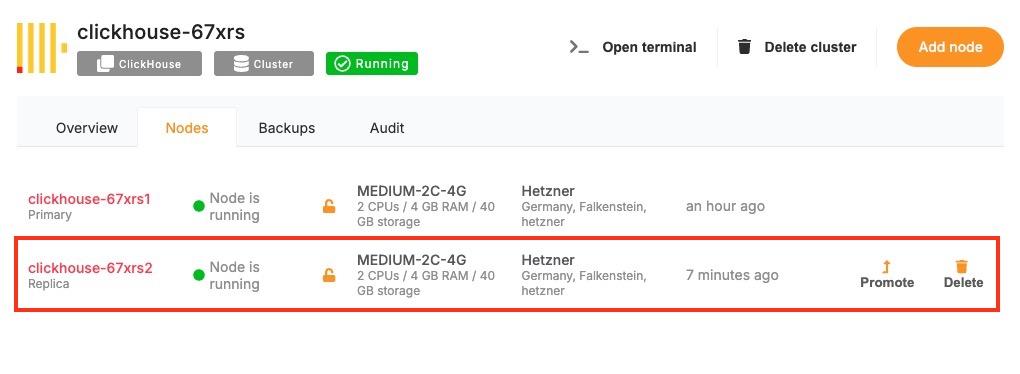](https://docs.elest.io/uploads/images/gallery/2025-06/screenshot-2025-06-09-at-1-20-18-pm.jpg)
Once provisioned, the new node will appear in the node list with its own metrics and status indicators. You can monitor its activity, verify that workloads are being scheduled to it, and access its logs directly from the dashboard. From this point onward, the node behaves like any other in the cluster and can be managed using the same lifecycle actions such as rebooting or draining.
## **Post-Provisioning Considerations**
After the node has been added, it becomes part of the active cluster and is available for scheduling workloads. Elestio’s orchestration layer will begin using it automatically, but you can further customize service placement through resource constraints or affinity rules if needed.
For performance monitoring, the dashboard provides per-node metrics, including CPU load, memory usage, and disk I/O. This visibility helps you confirm that the new node is functioning correctly and contributing to workload distribution as expected.
Maintenance actions such as draining or rebooting the node are also available from the same interface, making it easy to manage the node lifecycle after provisioning.
# Promoting a Node
Clusters can be designed for high availability or role-based workloads, where certain nodes may take on leadership or coordination responsibilities. In these scenarios, promoting a node is a key administrative task. It allows you to change the role of a node. While not always needed in basic setups, node promotion becomes essential in distributed systems, replicated databases, or services requiring failover control.
## **When to Promote a Node?**
Promoting a node is typically performed in clusters where role-based architecture is used. In high-availability setups, some nodes may act as leaders while others serve as followers or replicas. If a leader node becomes unavailable or needs to be replaced, you can promote another node to take over its responsibilities and maintain continuity of service.
Node promotion is also useful when scaling out and rebalancing responsibilities across a larger cluster. For example, promoting a node to handle scheduling, state tracking, or replication leadership can reduce bottlenecks and improve responsiveness. In cases involving database clusters or consensus-driven systems, promotion ensures a clear and controlled transition of leadership without relying solely on automatic failover mechanisms.
## **Promote a Node in Elestio**
To promote a node, start by accessing the **Clusters** section in the [Elestio dashboard](https://dash.elest.io/). Choose the cluster containing the node you want to promote. Inside the cluster view, navigate to the **Nodes** tab to see the full list of nodes, including their current roles, health status, and resource usage. Locate the node that you want to promote and open its action menu. From here, select the **“Promote Node”** option.
[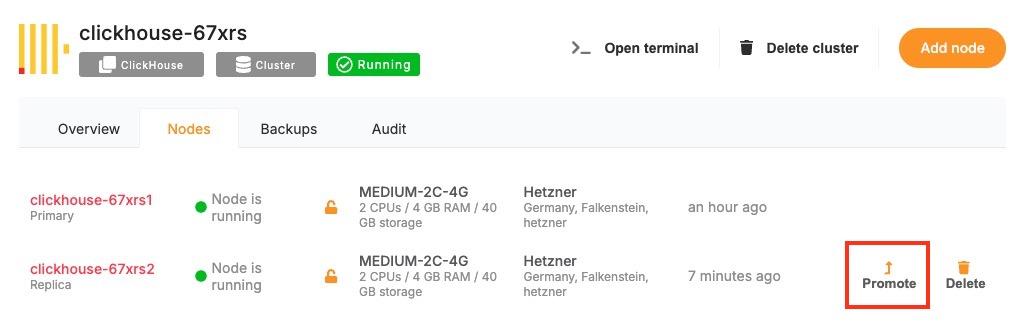](https://docs.elest.io/uploads/images/gallery/2025-06/screenshot-2025-06-09-at-1-22-42-pm.jpg)
You may be prompted to confirm the action, depending on the configuration and current role of the node. This confirmation helps prevent unintended role changes that could affect cluster behavior.
[](https://docs.elest.io/uploads/images/gallery/2025-06/2MCimage.png)
Once confirmed, Elestio will initiate the promotion process. This involves reconfiguring the cluster’s internal coordination state to acknowledge the new role of the promoted node. Depending on the service architecture and the software running on the cluster, this may involve reassigning leadership, updating replication targets, or shifting service orchestration responsibilities.
After promotion is complete, the node’s updated role will be reflected in the dashboard. At this point, it will begin operating with the responsibilities assigned to its new status. You can monitor its activity, inspect logs, and validate that workloads are being handled as expected.
## **Considerations for Promotion**
Before promoting a node, ensure that it meets the necessary resource requirements and is in a stable, healthy state. Promoting a node that is under high load or experiencing performance issues can lead to service degradation. It’s also important to consider replication and data synchronization, especially in clusters where stateful components like databases are in use.
Promotion is a safe and reversible operation, but it should be done with awareness of your workload architecture. If your system relies on specific leader election mechanisms, promoting a node should follow the design patterns supported by those systems.
# Removing a Node
Over time, infrastructure needs change. You may scale down a cluster after peak load, decommission outdated resources, or remove a node that is no longer needed for cost, isolation, or maintenance reasons. Removing a node from a cluster is a safe and structured process designed to avoid disruption. The dashboard provides an accessible interface for performing this task while preserving workload stability.
## **Why Remove a Node?**
Node removal is typically part of resource optimization or cluster reconfiguration. You might remove a node when reducing costs in a staging environment, when redistributing workloads across fewer or more efficient machines, or when phasing out a node for maintenance or retirement.
Another common scenario is infrastructure rebalancing, where workloads are shifted to newer nodes with better specs or different regions. Removing an idle or underutilized node can simplify management and reduce noise in your monitoring stack. It also improves scheduling efficiency by removing unneeded targets from the orchestration engine.
In high-availability clusters, node removal may be preceded by data migration or role reassignment (such as promoting a replica). Proper planning helps maintain system health while reducing reliance on unnecessary compute resources.
## **Remove a Node**
To begin the removal process, open the [Elestio dashboard](https://dash.elest.io/) and navigate to the **Clusters** section. Select the cluster that contains the node you want to remove. From within the cluster view, open the **Nodes** tab to access the list of active nodes and their statuses.
Find the node you want to delete from the list. If the node is currently running services, ensure that those workloads can be safely rescheduled to other nodes or are no longer needed. Since Elestio does not have a built-in drain option, any workload redistribution needs to be handled manually, either by adjusting deployments or verifying that redundant nodes are available. Once the node is drained and idle, open the action menu for that node and select **“Delete Node”**.
[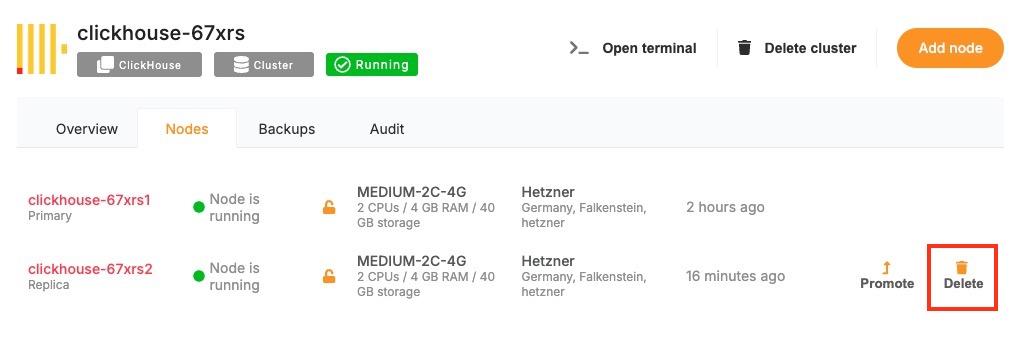](https://docs.elest.io/uploads/images/gallery/2025-06/screenshot-2025-06-09-at-1-24-05-pm.jpg)
The dashboard may prompt you to confirm the operation. After confirmation, Elestio will begin the decommissioning process. This includes detaching the node from the cluster, cleaning up any residual state, and terminating the associated virtual machine.
[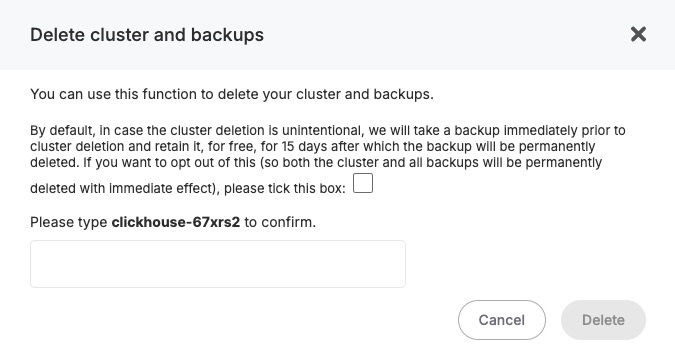](https://docs.elest.io/uploads/images/gallery/2025-06/bDHimage.png)
Once the operation completes, the node will no longer appear in the cluster’s node list, and its resources will be released.
## **Considerations for Safe Node Removal**
Before removing a node in Elestio, it’s important to review the services and workloads currently running on that node. Since Elestio does not automatically redistribute or migrate workloads during node removal, you should ensure that critical services are either no longer in use or can be manually rescheduled to other nodes in the cluster. This is particularly important in multi-node environments running stateful applications, databases, or services with specific affinity rules.
You should also verify that your cluster will have sufficient capacity after the node is removed. If the deleted node was handling a significant portion of traffic or compute load, removing it without replacement may lead to performance degradation or service interruption. In high-availability clusters, ensure that quorum-based components or replicas are not depending on the node targeted for deletion. Additionally, confirm that the node is not playing a special role such as holding primary data or acting as a manually promoted leader before removal. If necessary, reconfigure or promote another node prior to deletion to maintain cluster integrity.
# Backups and Restores
Reliable backups are essential for data resilience, recovery, and business continuity. Elestio provides built-in support for managing backups across all supported services, ensuring that your data is protected against accidental loss, corruption, or infrastructure failure. The platform includes an automated backup system with configurable retention policies and a straightforward restore process, all accessible from the dashboard. Whether you’re operating a production database or a test environment, understanding how backups and restores work in Elestio is critical for maintaining service reliability.
## **Cluster Backups**
Elestio provides multiple backup mechanisms designed to support various recovery and compliance needs. Backups are created automatically for most supported services, with consistent intervals and secure storage in managed infrastructure. These backups are performed in the background to ensure minimal performance impact and no downtime during the snapshot process. Each backup is timestamped, versioned, and stored securely with encryption. You can access your full backup history for any given service through the dashboard and select any version for restoration.
You can utilize different backup options depending on your preferences and operational requirements. Elestio supports **manual local backups** for on-demand recovery points, **automated snapshots** that capture the state of the service at fixed intervals, and **automated remote backups using Borg**, which securely stores backups on external storage volumes managed by Elestio. In addition, you can configure **automated external backups to S3-compatible storage**, allowing you to maintain full control over long-term retention and geographic storage preferences.
[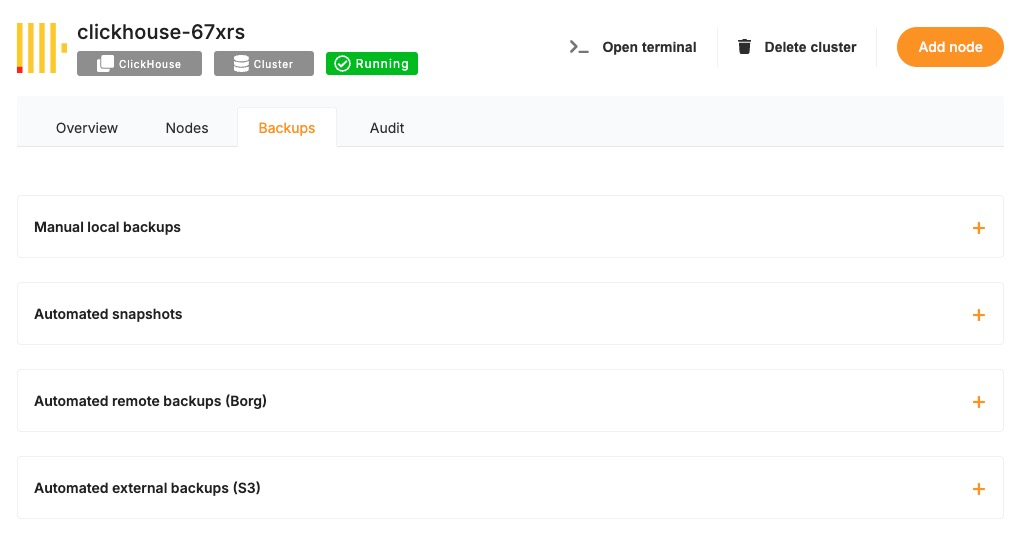](https://docs.elest.io/uploads/images/gallery/2025-06/zpYimage.png)
## **Restoring from a Backup**
Restoring a backup in Elestio is a user-initiated operation, available directly from the service dashboard. Once you’re in the dashboard, select the service you’d like to restore. Navigate to the **Backups** section, where you’ll find a list of all available backups along with their creation timestamps.
To initiate a restore, choose the desired backup version and click on the **“Restore”** option. You will be prompted to confirm the operation. Depending on the type of service, the restore can either overwrite the current state or recreate the service as a new instance from the selected backup.
[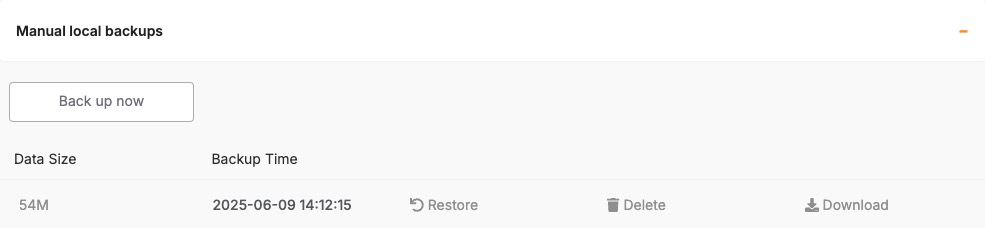](https://docs.elest.io/uploads/images/gallery/2025-06/WqMimage.png)
The restore process takes a few minutes, depending on the size of the backup and the service type. Once completed, the restored service is immediately accessible. In the case of databases, you can validate the restore by connecting to the database and inspecting the restored data.
## **Considerations for Backup & Restore**
- Before restoring a backup, it’s important to understand the impact on your current data. Restores may **overwrite existing service state**, so if you need to preserve the current environment, consider creating a manual backup before initiating the restore. In critical environments, restoring to a new instance and validating the data before replacing the original is a safer approach.
- Keep in mind that restore operations are not instantaneous and may temporarily affect service availability. It’s best to plan restores during maintenance windows or periods of low traffic, especially in production environments.
- For services with high-frequency data changes, be aware of the backup schedule and retention policy. Elestio’s default intervals may not capture every change, so for high-volume databases, consider exporting incremental backups manually or using continuous replication where supported.
## **Monitoring Backup Health**
Elestio provides visibility into your backup history directly through the dashboard. You can monitor the **status**, **timestamps**, and **success/failure** of backup jobs. In case of errors or failed backups, the dashboard will display alerts, allowing you to take corrective actions or contact support if necessary.
It’s good practice to periodically verify that backups are being generated and that restore points are recent and complete. This ensures you’re prepared for unexpected failures and that recovery options remain reliable.
# Cluster Resynchronization
In distributed systems, consistency and synchronization between nodes are critical to ensure that services behave reliably and that data remains accurate across the cluster. Elestio provides built-in mechanisms to detect and resolve inconsistencies across nodes using a feature called **Cluster Resynchronization**. This functionality ensures that node-level configurations, data replication, and service states are properly aligned, especially after issues like node recovery, temporary network splits, or service restarts.
## **Need for Cluster Resynchronization**
Resynchronization is typically required when secondary nodes in a cluster are no longer consistent with the primary node. This can happen due to temporary network failures, node restarts, replication lag, or partial service interruptions. In such cases, secondary nodes may fall behind or store incomplete datasets, which could lead to incorrect behavior if a failover occurs or if read operations are directed to those nodes. Unresolved inconsistencies can result in data divergence, serving outdated content, or failing health checks in load-balanced environments. Performing a resynchronization ensures that all secondary nodes are forcibly aligned with the current state of the primary node, restoring a clean and unified cluster state.
It may also be necessary to perform a resync after restoring a service from backup, during infrastructure migrations, or after recovering a previously offline node. In each of these cases, resynchronization acts as a corrective mechanism to ensure that every node is operating with the same configuration and dataset, reducing the risk of drift and maintaining data integrity across the cluster.
## **Cluster Resynchronization**
To perform a resynchronization, start by accessing the [Elestio dashboard](https://dash.elest.io/) and navigating to the **Clusters** section. Select the cluster where synchronization is needed. On the **Cluster Overview** page, scroll down slightly until you find the **“Resync Cluster”** option. This option is visible as part of the cluster controls and is available only in clusters with multiple nodes and a defined primary node.
[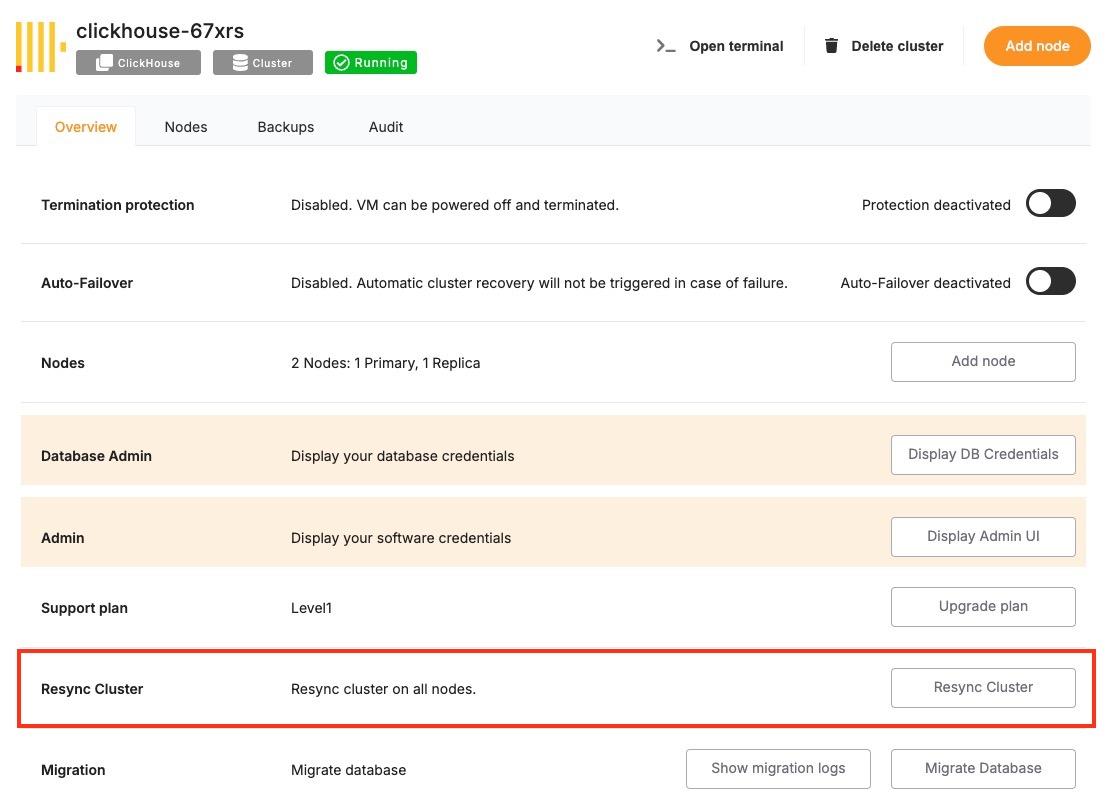](https://docs.elest.io/uploads/images/gallery/2025-06/screenshot-2025-06-09-at-2-31-04-pm.jpg)
Clicking the **Resync** button opens a confirmation dialog. The message clearly explains that this action will initiate a request to resynchronize **all secondary nodes**. During the resync process, **existing data on all secondary nodes will be erased and replaced with a copy of the data from the primary node**. This operation ensures full consistency across the cluster but should be executed with caution, especially if recent changes exist on any of the secondaries that haven’t yet been replicated.
[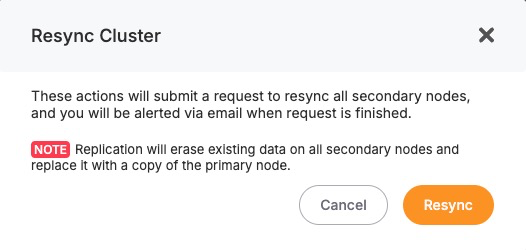](https://docs.elest.io/uploads/images/gallery/2025-06/Kfkimage.png)
You will receive an email notification once the resynchronization is complete. During this process, Elestio manages the replication safely, but depending on the size of the data, the operation may take a few minutes. It’s advised to avoid making further changes to the cluster while the resync is in progress.
## **Considerations Before Resynchronizing**
- Before triggering a resync, it’s important to verify that the primary node holds the desired state and that the secondary nodes do not contain any critical unsynced data. Since the resync **overwrites** the secondary nodes completely, any local changes on those nodes will be lost.
- This action is best used when you’re confident that the primary node is healthy, current, and stable. Avoid initiating a resync if the primary has recently experienced errors or data issues. Additionally, consider performing this operation during a low-traffic period, as synchronization may temporarily impact performance depending on the data volume.
- If your application requires high consistency guarantees, it’s recommended to monitor your cluster closely during and after the resync to confirm that services are functioning correctly and that the replication process completed successfully.
# Database Migration
When managing production-grade services, the ability to perform reliable and repeatable database migrations is critical. Whether you’re applying schema changes, updating seed data, or managing version-controlled transitions, Elestio provides a built-in mechanism to execute migrations safely from the dashboard. This functionality is especially relevant when running containerized database services like ClickHouse, or similar within a managed cluster.
## **Need for Migrations**
Database migrations are commonly required when updating your application’s data model or deploying new features. Schema updates such as adding columns, modifying data types, creating indexes, or introducing new tables need to be synchronized with the deployment lifecycle of your application code.
Migrations may also be needed during version upgrades to introduce structural or configuration changes required by newer database engine versions. In some cases, teams use migrations to apply baseline datasets, adjust permissions, or clean up legacy objects. Running these changes through a controlled migration system ensures consistency across environments and helps avoid untracked manual changes.
## **Running Database Migration**
To run a database migration in Elestio, start by logging into the [Elestio dashboard](https://dash.elest.io/) and navigating to the **Clusters** section. Select the cluster that contains the target database service. From the **Cluster Overview** page, scroll down until you find the **“Migration”** option.
[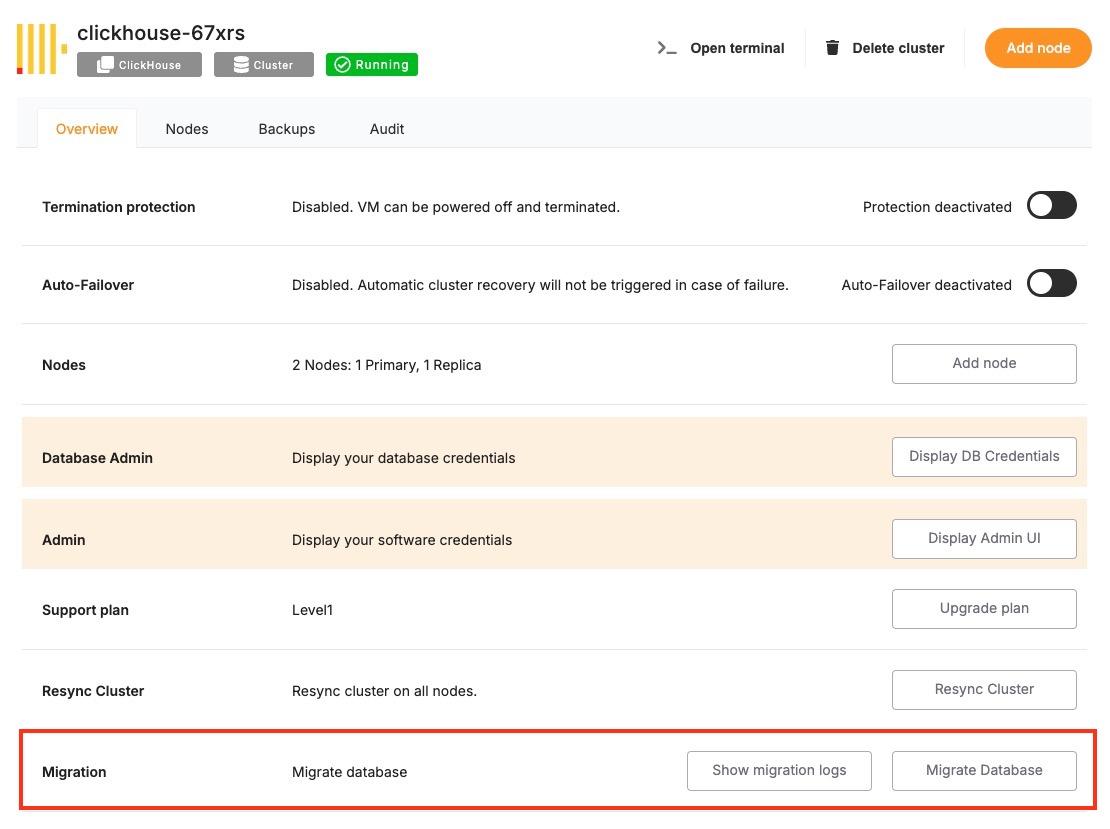](https://docs.elest.io/uploads/images/gallery/2025-06/screenshot-2025-06-09-at-3-09-45-pm.jpg)
Clicking this option will open the migration workflow, which follows a **three-step process**: **Configure**, **Validation**, and **Migration**. In the **Configure** step, Elestio provides a migration configuration guide specific to the database type, such as ClickHouse. At this point, you must ensure that your target service has sufficient **disk space** to complete the migration. If there is not enough storage available, the migration may fail midway, so it’s strongly recommended to review storage utilization beforehand.
[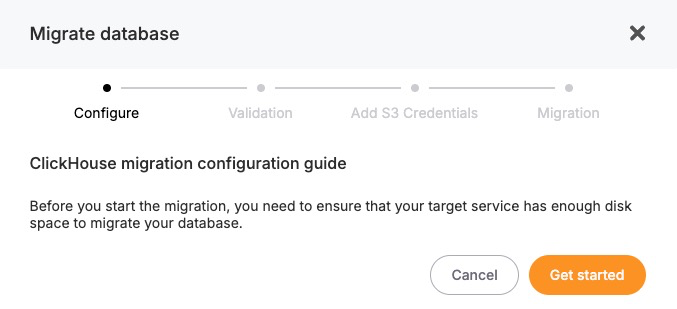](https://docs.elest.io/uploads/images/gallery/2025-06/9v6image.png)
Once configuration prerequisites are met, you can proceed to the **Validation** step. Elestio will check the secondary database details you have provided for the migration.
[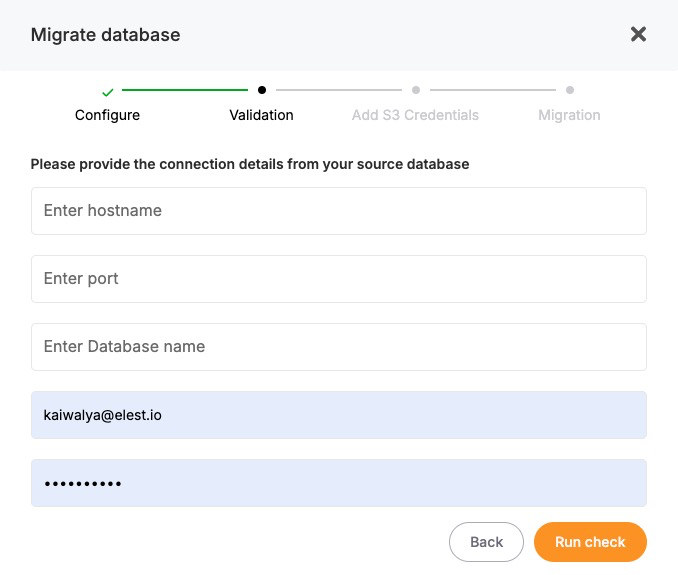](https://docs.elest.io/uploads/images/gallery/2025-06/QFjimage.png)
If the validation passes, the final **Migration** step will become active. You can then initiate the migration process. Elestio will handle the actual data transfer, schema replication, and state synchronization internally. The progress is tracked, and once completed, the migrated database will be fully operational on the target service.
## **Considerations Before Running Migrations**
- Before running any migration, it’s important to validate the script or changes in a staging environment. Since migrations may involve irreversible changes such as dropping columns, altering constraints, or modifying data careful review and version control are essential.
- In production environments, plan migrations during maintenance windows or low-traffic periods to minimize the impact of any schema locks or temporary unavailability. If you’re using replication or high-availability setups, confirm that the migration is compatible with your architecture and will not disrupt synchronization between primary and secondary nodes.
- You should also ensure that proper backups are in place before applying structural changes. In Elestio, the backup feature can be used to create a restore point that allows rollback in case the migration introduces issues.
# Delete a Cluster
When a cluster is no longer needed whether it was created for testing, staging, or an obsolete workload deleting it helps free up resources and maintain a clean infrastructure footprint. Elestio provides a straightforward and secure way to delete entire clusters directly from the dashboard. This action permanently removes the associated services, data, and compute resources tied to the cluster.
## **When to Delete a Cluster**
Deleting a cluster is a final step often performed when decommissioning an environment. This could include shutting down a test setup, replacing infrastructure during migration, or retiring an unused production instance. In some cases, users also delete and recreate clusters as part of major version upgrades or architectural changes. It is essential to confirm that all data and services tied to the cluster are no longer required or have been backed up or migrated before proceeding. Since cluster deletion is irreversible, any services, volumes, and backups associated with the cluster will be permanently removed.
## **Delete a Cluster**
To delete a cluster, log in to the [Elestio dashboard](https://dash.elest.io/) and navigate to the **Clusters** section. From the list of clusters, select the one you want to remove. Inside the selected cluster, you’ll find a **navigation bar** at the top of the page. One of the available options in this navigation bar is **“Delete Cluster.”**
[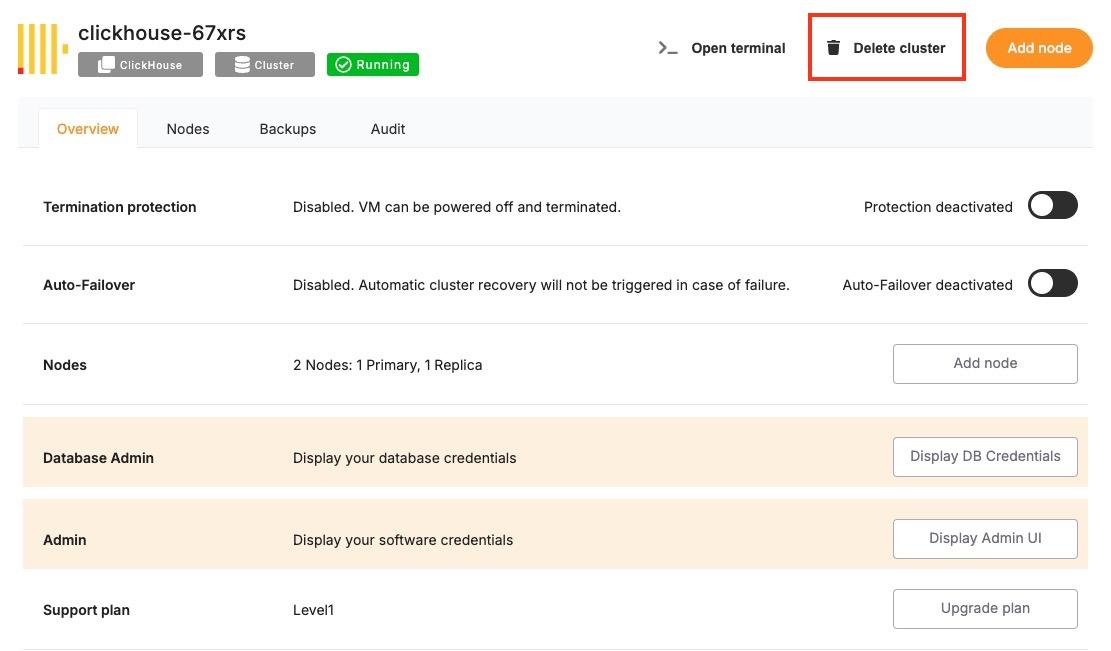](https://docs.elest.io/uploads/images/gallery/2025-06/screenshot-2025-06-09-at-3-20-11-pm.jpg)
Clicking this opens a confirmation dialog that outlines the impact of deletion. It will clearly state that deleting the cluster will **permanently remove** all associated services, storage, and configurations. By acknowledging a warning or typing in the cluster name, depending on the service type. Once confirmed, Elestio will initiate the deletion process, which includes tearing down all resources associated with the cluster. This typically completes within a few minutes, after which the cluster will no longer appear in your dashboard.
[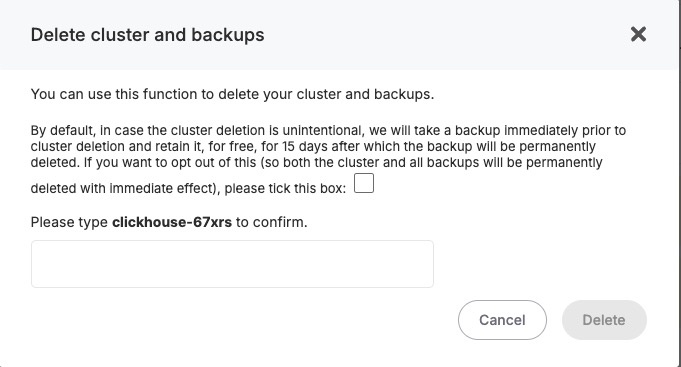](https://docs.elest.io/uploads/images/gallery/2025-06/ea9image.png)
## **Considerations Before Deleting**
Deleting a cluster also terminates any linked domains, volumes, monitoring configurations, and scheduled backups. These cannot be recovered once deletion is complete, so plan accordingly before confirming the action. If the cluster was used for production workloads, consider archiving data to external storage (e.g., S3) or exporting final snapshots for compliance and recovery purposes.
Before deleting a cluster, verify that:
- All required data has been backed up externally (e.g., downloaded dumps or exports).
- Any active services or dependencies tied to the cluster have been reconfigured or shut down.
- Access credentials, logs, or stored configuration settings have been retrieved if needed for auditing or migration.
# Restricting Access by IP
Securing access to services is a fundamental part of managing cloud infrastructure. One of the most effective ways to reduce unauthorized access is by restricting connectivity to a defined set of IP addresses. Elestio supports IP-based access control through its dashboard, allowing you to explicitly define which IPs or IP ranges are allowed to interact with your services. This is particularly useful when exposing databases, APIs, or web services over public endpoints.
## **Need to Restrict Access by IP**
Restricting access by IP provides a first layer of network-level protection. Instead of relying solely on application-layer authentication, you can control who is allowed to even initiate a connection to your service. This approach reduces the surface area for attacks such as brute-force login attempts, automated scanning, or unauthorized probing.
Common use cases include:
- Limiting access to production databases from known office networks or VPNs.
- Allowing only CI/CD pipelines or monitoring tools with static IPs to connect.
- Restricting admin dashboards or internal tools to internal teams.
By defining access rules at the infrastructure level, you gain more control over who can reach your services, regardless of their authentication or API access status.
## **Restrict Access by IP**
To restrict access by IP in Elestio, start by logging into the [Elestio dashboard](https://dash.elest.io/) and navigating to the **Clusters** section. Select the cluster that hosts the service you want to protect. Once inside the **Cluster Overview** page, locate the **Security** section.
[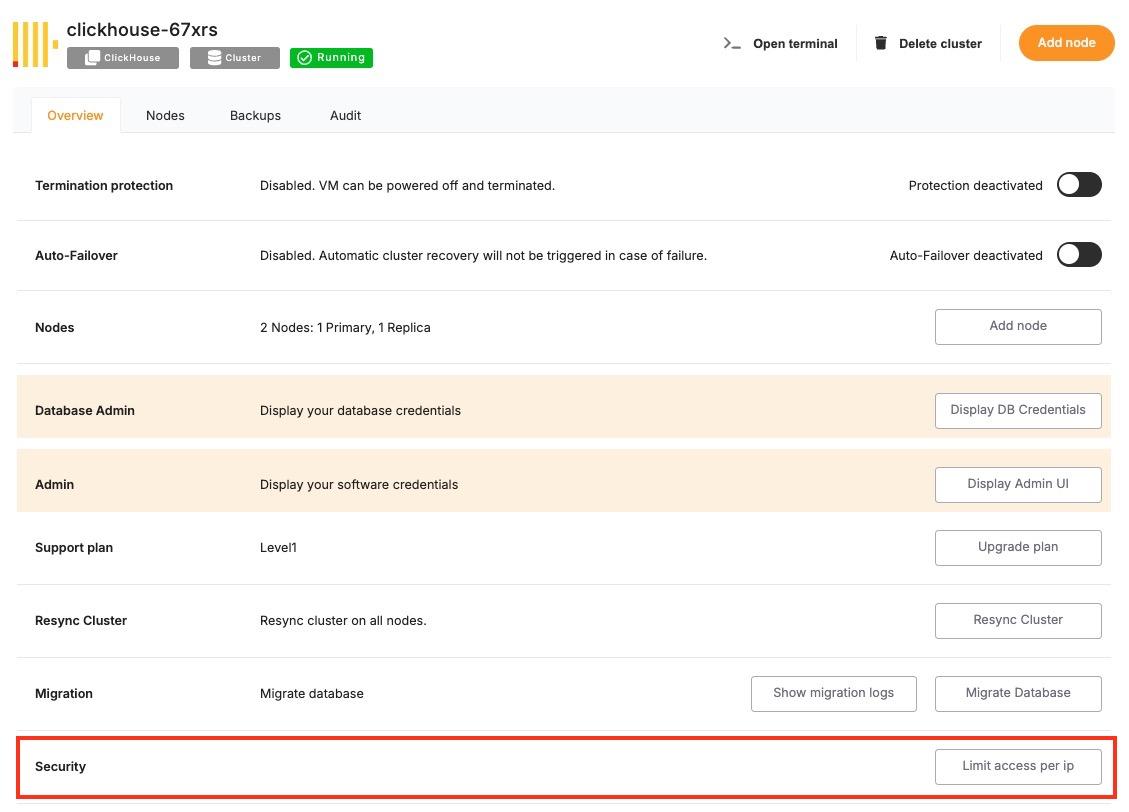](https://docs.elest.io/uploads/images/gallery/2025-06/screenshot-2025-06-09-at-3-24-25-pm.jpg)
Within this section, you’ll find a setting labelled **“Limit access per IP”**. This is where you can define which IP addresses or CIDR ranges are permitted to access the services running in the cluster. You can add a specific IPv4 or IPv6 address (e.g., 203.0.113.5) or a subnet in CIDR notation (e.g., 203.0.113.0/24) to allow access from a range of IPs.
[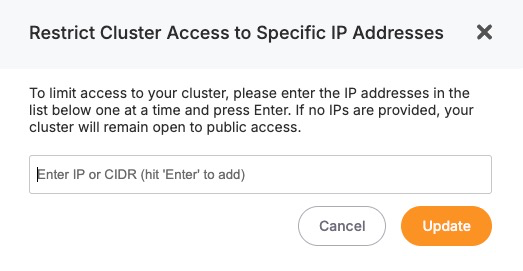](https://docs.elest.io/uploads/images/gallery/2025-06/tS8image.png)
After entering the necessary IP addresses, save the configuration. The changes will apply to all services running inside the cluster, and only the defined IPs will be allowed to establish network connections. All other incoming requests from unlisted IPs will be blocked at the infrastructure level.
## **Considerations When Using IP Restrictions**
- When applying IP restrictions, it’s important to avoid locking yourself out. Always double-check that your own IP address is included in the allowlist before applying rules, especially when working on remote infrastructure.
- For users on dynamic IPs (e.g., home broadband connections), consider using a VPN or a static jump host that you can reliably allowlist. Similarly, if your services are accessed through cloud-based tools, make sure to verify their IP ranges and update your rules accordingly when those IPs change.
- In multi-team environments, document and review IP access policies regularly to avoid stale rules or overly permissive configurations. Combine IP restrictions with secure authentication and encrypted connections (such as HTTPS or SSL for databases) for layered security.