How-To Guides
- Creating a Database
- Upgrading to a Major Version
- Installing or Updating an Extension
- Creating Manual Backups
- Restoring a Backup
- Identifying Slow Queries
- Detect and terminate long-running queries
- Preventing Full Disk Issues
- Checking Database Size and Related Issues
Creating a Database
PostgreSQL allows you to create databases using different methods, including the PostgreSQL interactive shell (psql), Docker (assuming PostgreSQL is running inside a container), and the command-line interface (createdb). This guide explains each method step-by-step, covering required permissions, best practices, and troubleshooting common issues.
Creating Using psql CLI
PostgreSQL is a database system that stores and manages structured data efficiently. The psql tool is an interactive command-line interface (CLI) that allows users to execute SQL commands directly on a PostgreSQL database. Follow these steps to create a database:
Connect to PostgreSQL
Open terminal on your local system, and if PostgreSQL is installed locally, connect using the following command. If not installed, install from official website:
psql -U postgresFor a remote database, use:
psql -h HOST -U USER -d DATABASEReplace HOST with the database server address, USER with the PostgreSQL username, and DATABASE with an existing database name.
Create a New Database
Inside the psql shell, run:
CREATE DATABASE mydatabase;The default settings will apply unless specified otherwise. To customize the encoding and collation, use:
CREATE DATABASE mydatabase ENCODING 'UTF8' LC_COLLATE 'en_US.UTF-8' LC_CTYPE 'en_US.UTF-8' TEMPLATE template0;Creating Database in Docker
Docker is a tool that helps run applications in isolated environments called containers. A PostgreSQL container provides a self-contained database instance that can be quickly deployed and managed. If you are running PostgreSQL inside a Docker container, follow these steps:
Access Elestio Terminal
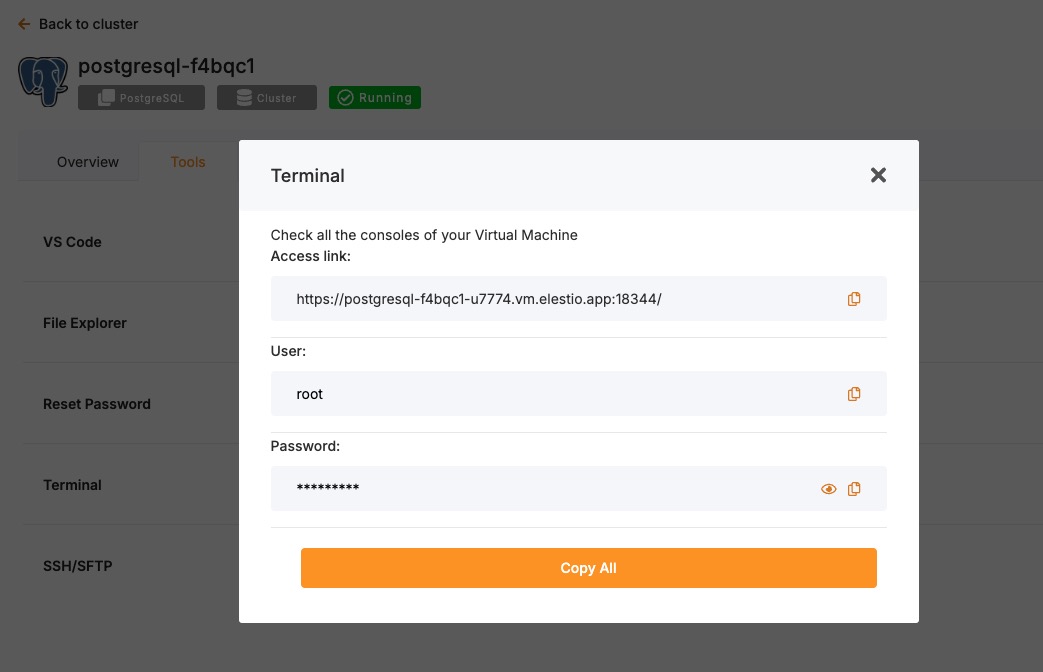
Head over to your deployed PostgreSQL service dashboard and head over to Tools > Terminal. Use the credentials provided there to log in to your terminal.
Once you are in your terminal, run the following command to head over to the correct directory to perform the next steps
cd /opt/app/Access the PostgreSQL Container Shell
docker-compose exec postgres bashUse Environment Variables to Connect via psql
Once inside the container shell, if environment variables like POSTGRES_USER and POSTGRES_DB are already set in the stack, you can use them directly:
psql -U "$POSTGRES_USER" -d "$POSTGRES_DB"
Or use the default one:
psql -U postgresCreate Database
Now, to create a database, use the following command. This command tells PostgreSQL to create a new logical database called mydatabase. By default, it inherits settings like encoding and collation from the template database (template1), unless specified otherwise.
CREATE DATABASE mydatabase;You can quickly list the database you just created using the following command
/lCreating Using createdb CLI
The createdb command simplifies database creation from the terminal without using psql.
Ensure PostgreSQL is Running
Check the PostgreSQL service status, this ensures that the PostgreSQL instance is running on your local instance:
sudo systemctl status postgresqlIf not running, start it:
sudo systemctl start postgresqlCreate a Database
Now, you can create a simple database using the following command:
createdb -U postgres mydatabaseTo specify encoding and collation:
createdb -U postgres --encoding=UTF8 --lc-collate=en_US.UTF-8 --lc-ctype=en_US.UTF-8 mydatabaseVerify Database Creation
List all databases using the following commands, as it will list all the databases available under your PostgreSQL:
psql -U postgres -lConnect to the New Database
Next, you can easily connect with the database using the psql command and start working on it.
psql -U postgres -d mydatabaseRequired Permissions for Database Creation
Creating a database requires the CREATEDB privilege. By default, the postgres user has this privilege. To grant it to another user:
ALTER USER username CREATEDB;For restricted access, assign specific permissions:
CREATE ROLE newuser WITH LOGIN PASSWORD 'securepassword';
GRANT CONNECT ON DATABASE mydatabase TO newuser;
GRANT USAGE ON SCHEMA public TO newuser;
GRANT SELECT, INSERT, UPDATE, DELETE ON ALL TABLES IN SCHEMA public TO newuser;
Best Practices for Creating Databases
- Use Meaningful Names: Choosing clear and descriptive names for databases helps in organization and maintenance. Avoid generic names like
testdbordatabase1, as they do not indicate the database’s purpose. Instead, use names that reflect the type of data stored, such ascustomer_dataorsales_records. Meaningful names make it easier for developers and administrators to understand the database’s function without extra documentation. - Follow Naming Conventions: A standardized naming convention ensures consistency across projects and simplifies database management. PostgreSQL is case-sensitive, so using lowercase letters and underscores (e.g.,
order_details) is recommended to avoid unnecessary complexities. Avoid spaces and special characters in names, as they require additional quoting in SQL queries. - Restrict User Permissions: Granting only the necessary permissions improves database security and reduces risks. By default, users should have the least privilege required for their tasks, such as read-only access for reporting tools. Superuser or administrative privileges should be limited to trusted users to prevent accidental or malicious changes. Using roles and groups simplifies permission management and ensures consistent access control.
- Enable Backups: Regular backups ensure data recovery in case of accidental deletions, hardware failures, or security breaches. PostgreSQL provides built-in tools like
pg_dumpfor single-database backups andpg_basebackupfor full-instance backups. Automating backups using cron jobs or scheduling them through a database management tool reduces the risk of data loss. - Monitor Performance: Monitoring database performance helps identify bottlenecks, optimize queries, and ensure efficient resource utilization. PostgreSQL provides system views like
pg_stat_activityandpg_stat_databaseto track query execution and database usage. Analyzing slow queries usingEXPLAIN ANALYZEhelps in indexing and optimization.
SELECT datname, numbackends, xact_commit, blks_read FROM pg_stat_database;Common Issues and Troubleshooting
| Issue | Possible Cause | Solution |
|---|---|---|
ERROR: permission denied to create database |
User lacks CREATEDB privileges |
Grant permission using ALTER USER username CREATEDB; |
ERROR: database "mydatabase" already exists |
Database name already taken | Use a different name or drop the existing one with DROP DATABASE mydatabase; |
FATAL: database "mydatabase" does not exist |
Attempting to connect to a non-existent database | Verify creation using \l |
psql: could not connect to server |
PostgreSQL is not running | Start PostgreSQL with sudo systemctl start postgresql |
ERROR: role "username" does not exist |
The specified user does not exist | Create the user with CREATE ROLE username WITH LOGIN PASSWORD 'password'; |
Upgrading to a Major Version
Upgrading a database service on Elestio can be done without creating a new instance or performing a full manual migration. Elestio provides a built-in option to change the database version directly from the dashboard. This is useful for cases where the upgrade does not involve breaking changes or when minimal manual involvement is preferred. The version upgrade process is handled by Elestio internally, including restarting the database service if required. This method reduces the number of steps involved and provides a way to keep services up to date with minimal configuration changes.
Log In and Locate Your Service
To begin the upgrade process, log in to your Elestio dashboard and navigate to the specific database service you want to upgrade. It is important to verify that the correct instance is selected, especially in environments where multiple databases are used for different purposes such as staging, testing, or production. The dashboard interface provides detailed information for each service, including version details, usage metrics, and current configuration. Ensure that you have access rights to perform upgrades on the selected service. Identifying the right instance helps avoid accidental changes to unrelated environments.
Back Up Your Data
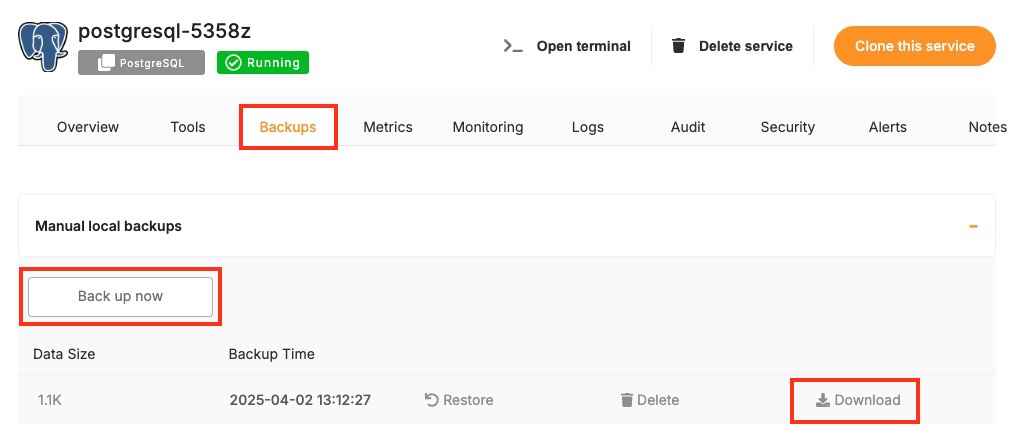
Before starting the upgrade, create a backup of your database. A backup stores the current state of your data, schema, indexes, and configuration, which can be restored if something goes wrong during the upgrade. In Elestio, this can be done through the Backups tab by selecting Back up now under Manual local backups and Download the backup file. Scheduled backups may also be used, but it is recommended to create a manual one just before the upgrade. Keeping a recent backup allows quick recovery in case of errors or rollback needs. This is especially important in production environments where data consistency is critical.
Select the New Version
Once your backup is secure, proceed to the Overview and then Software > Change version tab within your database service page.
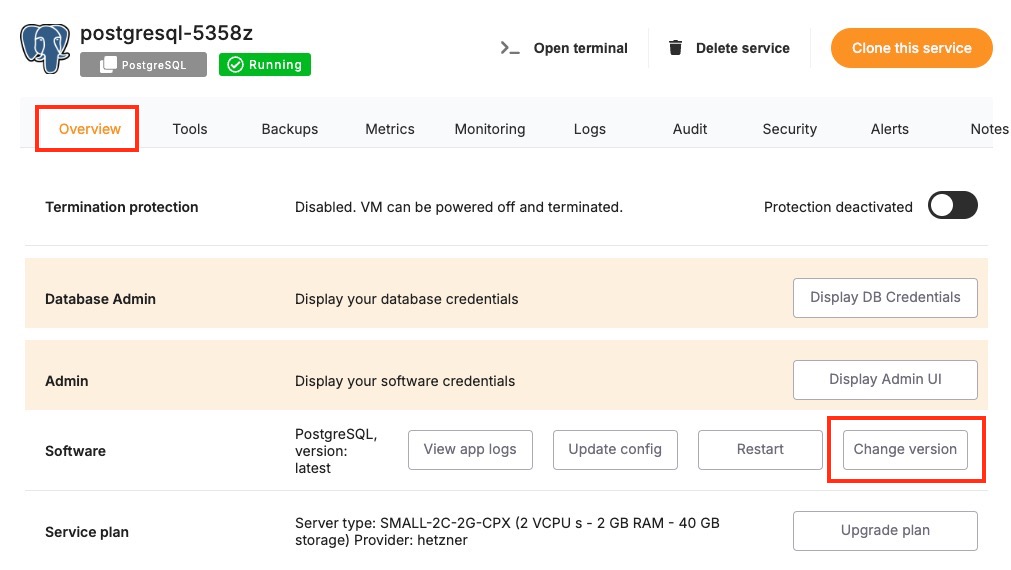
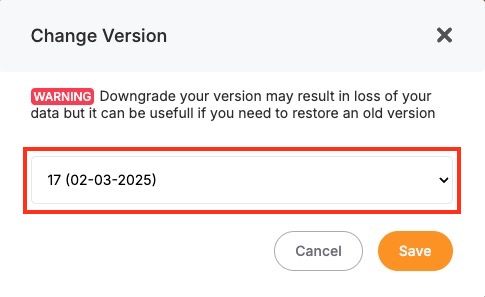
Here, you'll find an option labeled Change Version. In the Change Version menu, select the desired database version from the available list. After confirming the version, Elestio will begin the upgrade process automatically. During this time, the platform takes care of the version change and restarts the database if needed. No manual commands are required, and the system handles most of the operational aspects in the background.
Monitor the Upgrade Process
The upgrade process may include a short downtime while the database restarts. Once it is completed, it is important to verify that the upgrade was successful and the service is operating as expected. Start by checking the logs available in the Elestio dashboard for any warnings or errors during the process. Then, review performance metrics to ensure the database is running normally and responding to queries. Finally, test the connection from your client applications to confirm that they can interact with the upgraded database without issues.
Installing or Updating an Extension
PostgreSQL supports a wide range of extensions that add extra functionality to the core database system. Extensions like uuid-ossp, pg_trgm, and postgis are often used to provide features for text search, spatial data, UUID generation, and more. If you are running PostgreSQL on Elestio, you can enable many of these extensions directly within your database. This document explains how to enable, manage, and troubleshoot PostgreSQL extensions in an Elestio-hosted environment. It also includes guidance on checking extension compatibility with different PostgreSQL versions.
Installing and Enabling Extensions
PostgreSQL extensions can be installed in each database individually. Most common extensions are included in the PostgreSQL installation on Elestio. To enable an extension, you need to connect to your database using a tool like psql.
Start by connecting to your PostgreSQL database. You can follow the detailed documentation as provided here.
Once connected, you can enable an extension using the CREATE EXTENSION command. For example, to enable the uuid-ossp extension:
CREATE EXTENSION IF NOT EXISTS "uuid-ossp";To check which extensions are already installed in your current database, use the `\dx` command within psql. If you want to see all available extensions on the server, use:
SELECT * FROM pg_available_extensions ORDER BY name;If the extension you need is not listed in the available extensions, it may not be installed on the server.
Checking Extension Compatibility
Each PostgreSQL extension is built for a specific PostgreSQL version. Not all extensions are compatible across major versions. Before upgrading PostgreSQL or deploying an extension, it is important to check whether the extension is compatible with the version you are using.
To check the installed version of an extension and the default version provided by the system, run:
SELECT name, default_version, installed_version
FROM pg_available_extensions
WHERE name = 'pg_trgm';
If you are planning to upgrade your PostgreSQL version, it is recommended to deploy a new instance with the target version and run the above query to see if the extension is available and compatible. Some extensions may require specific builds for each version of PostgreSQL. After upgrading your database, you may also need to update your extensions using:
ALTER EXTENSION <extension_name> UPDATE;This ensures the extension objects in the database match the new database version.
Troubleshooting Common Extension Issues
There are some common issues users may encounter when working with extensions. These usually relate to missing files, permission problems, or version mismatches.
If you see an error like could not open extension control file, it means the extension is not installed on the server. This usually happens when the extension is not included in the PostgreSQL installation. If the error message says that the extension already exists, it means it has already been installed in the database. You can confirm this with the \dx command or the query:
SELECT * FROM pg_extension;If you need to reinstall it, you can drop and recreate it. Be careful, as dropping an extension with CASCADE may remove objects that depend on it:
DROP EXTENSION IF EXISTS <extension_name> CASCADE;
CREATE EXTENSION <extension_name>;
Another common issue appears after upgrading PostgreSQL, where some functions related to the extension stop working. This is often due to the extension not being updated. Running the following command will usually fix this.
ALTER EXTENSION <name> UPDATE;In some cases, you may get a permission denied error when trying to create an extension. This means your database role does not have the required privileges. You will need to connect using a superuser account like postgres, or request that Elestio enable the extension for you.
Creating Manual Backups
Regular backups are a key part of managing a PostgreSQL deployment. While Elestio provides automated backups by default, you may want to perform manual backups for specific reasons, such as preparing for a major change, keeping a local copy, or testing backup automation. This guide walks through how to create PostgreSQL backups on Elestio using multiple approaches. It covers manual backups through the Elestio dashboard, using PostgreSQL CLI tools, and Docker Compose-based setups. It also includes advice for backup storage, retention policies, and automation using scheduled jobs.
Manual Service Backups on Elestio
If you’re using Elestio’s managed PostgreSQL service, the easiest way to create a manual backup is through the dashboard. This built-in method creates a full snapshot of your current database state and stores it within Elestio’s infrastructure. These backups are tied to your service and can be restored through the same interface. This option is recommended when you need a quick, consistent backup without using any terminal commands.
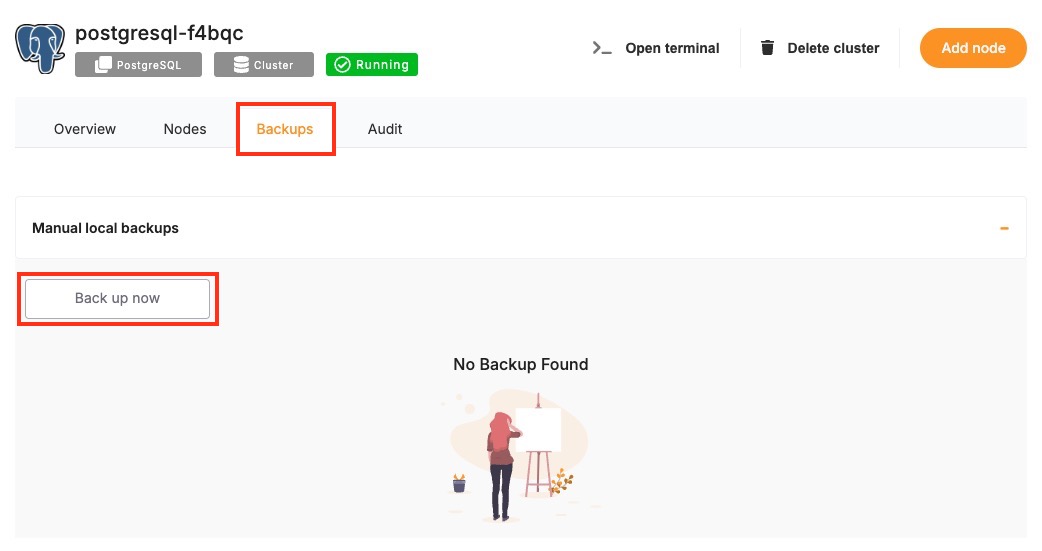
To trigger a manual backup from the Elestio dashboard:
-
Log in to the Elestio dashboard and navigate to your PostgreSQL service/cluster.
-
Click the Backups tab in the service menu.
-
Select Back up now to generate a snapshot.
Manual Backups Using PostgreSQL CLI
PostgreSQL provides a set of command-line tools that are useful when you want to create backups from your terminal. These include pg_dump exporting the database, psql for basic connectivity and queries, and pg_restore restoring backups. This approach is useful when you need to store backups locally or use them with custom automation workflows. The CLI method gives you full control over the backup format and destination.
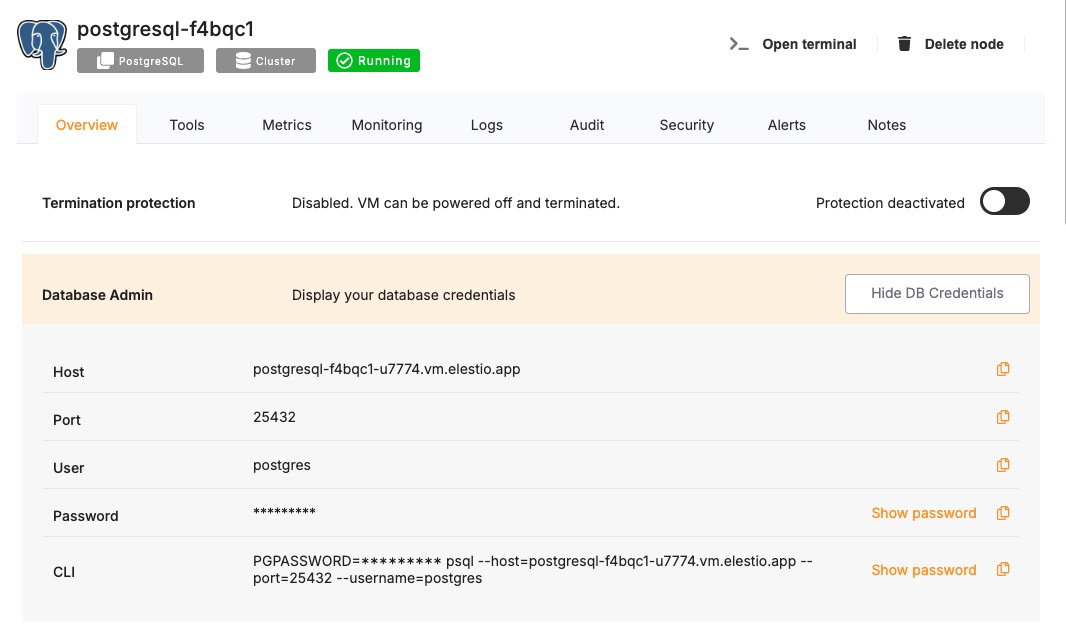
Collect Database Connection Info
To use the CLI tools, you’ll need the database host, port, name, username, and password. These details can be found in the Overview section of your PostgreSQL service in the Elestio dashboard.
Back Up with pg_dump
Use pg_dump to export the database in a custom format. This format is flexible and preferred for restore operations using pg_restore. Replace the values with actual values that you copied from the Elestio overview page.
PGPASSWORD='<your-db-password>' pg_dump \
  -U <username> \
  -h <host> \
  -p <port> \
  -Fc -v \
  -f <output_file>.dump \
  <database_name>
This command connects to the Elestio database and creates a .dump file containing your data. You can use the -v flag for verbose output and confirm that the backup completed successfully.
Manual Backups Using Docker Compose
If your PostgreSQL database is deployed through a Docker Compose setup on Elestio, you can run the pg_dump command from within the running container. This is useful when the tools are installed inside the container environment and you want to keep everything self-contained. The backup can be created inside the container and then copied to your host system for long-term storage or transfer.
Access Elestio Terminal
Head over to your deployed PostgreSQL service dashboard and head over to Tools > Terminal. Use the credentials provided there to log in to your terminal.
Once you are in your terminal, run the following command to head over to the correct directory to perform the next steps
cd /opt/app/Run pg_dump Inside the Container
This command runs pg_dump from inside the container and saves the backup to a file in /tmp. Make sure you have the following things in command in your env, else replace them with actual values and not the env variables.
docker-compose exec postgres \
  bash -c "PGPASSWORD='\$POSTGRES_PASSWORD' pg_dump -U \$POSTGRES_USER -Fc -v \$POSTGRES_DB > /tmp/manual_backup.dump"
This assumes that environment variables like POSTGRES_USER, POSTGRES_PASSWORD, and POSTGRES_DB are defined in your Compose setup.
Copy Backup to Host
After creating the backup inside the container, use docker cp to copy the file to your host machine.
docker cp $(docker-compose ps -q postgres):/tmp/manual_backup.dump ./manual_backup.dumpThis creates a local copy of the backup file, which you can then upload to external storage or keep for versioned snapshots.
Backup Storage & Retention Best Practices
Once backups are created, they should be stored securely and managed with a clear retention policy. Proper naming, encryption, and rotation reduce the risk of data loss and help during recovery. Use timestamped filenames to identify when the backup was created. External storage services such as AWS S3, Backblaze B2, or an encrypted server volume are recommended for long-term storage.
Here are some guidelines to follow:
-
Name your backups clearly:
mydb_backup_2024_04_02.dump. -
Store in secure, off-site storage if possible.
-
Retain 7 daily backups, 4 weekly backups, and 3–6 monthly backups.
-
Remove old backups automatically to save space.
By combining storage hygiene with regular scheduling, you can maintain a reliable backup history and reduce manual effort.
Automating Manual Backups (cron)
Manual backup commands can be scheduled using tools like cron on Linux-based systems. This allows you to regularly back up your database without needing to run commands manually. Automating the process also reduces the risk of forgetting backups and ensures more consistent retention.
Example: Daily Backup at 2 AM
Open your crontab file for editing:
crontab -eThen add a job like the following:
0 2 * * * PGPASSWORD='mypassword' pg_dump -U elestio -h db-xyz.elestio.app -p 5432 -Fc -f /backups/backup_$(date +\%F).dump mydatabaseMake sure the /backups/ directory exists and is writable by the user running the job. You can also compress the backup and upload it to a remote destination as part of the same script.
Restoring a Backup
Restoring backups is essential for recovery, environment duplication, or rollback scenarios. Elestio supports restoring backups both through its built-in dashboard and via command-line tools like pg_restore psql. You can also restore from inside Docker Compose environments. This guide provides detailed steps for full and partial restores using each method and explains how to address common errors that occur during restoration.
Restoring from a Backup via Terminal
This method is used when you’ve created a .dump file using pg_dump in custom format. You can restore it using pg_restore, which gives you fine-grained control over what gets restored. This is useful for restoring backups to new environments, during version upgrades, or testing data locally.
Create the target database if it does not exist
If the database you’re restoring into doesn’t already exist, you must create it first.
PGPASSWORD='<your-password>' createdb \
  -U <username> \
  -h <host> \
  -p <port> \
  <database_name>
Run pg_restore to import the backup
This command restores the full contents of the .dump file into the specified database.
PGPASSWORD='<your-password>' pg_restore \
  -U <username> \
  -h <host> \
  -p <port> \
  -d <database_name> \
  -v <backup_file>.dump
You can add --clean to drop existing objects before restoring.
Restoring via Docker Compose
If your PostgreSQL service is deployed using Docker Compose, you can restore the database inside the container environment. This is useful when PostgreSQL runs in an isolated Docker setup, and you want to handle all backup and restore processes inside that environment.
Copy the backup into the container
Use docker cp to move the .dump file from your host machine to the PostgreSQL container.
docker cp ./manual_backup.dump $(docker-compose ps -q postgres):/tmp/manual_backup.dumpRun the restore inside the container
Use pg_restore from within the container to restore the file to the database.
docker-compose exec postgres \
  bash -c "PGPASSWORD='\$POSTGRES_PASSWORD' pg_restore -U \$POSTGRES_USER -d \$POSTGRES_DB -Fc -v /tmp/manual_backup.dump"
Make sure your environment variables in the Docker Compose file match the values used here.
Partial Restores
PostgreSQL supports partial restores, allowing you to restore only selected tables, schemas, or schema definitions. This can be useful when recovering a specific part of the database or testing part of the data.
Restore a specific table
Use the -t flag to restore only one table from the .dump file.
PGPASSWORD='<your-password>' pg_restore \
  -U <username> \
  -h <host> \
  -p <port> \
  -d <database_name> \
  -t <table_name> \
  -v <backup_file>.dump
Restore schema only (no data)
This command will restore only the table structures, types, functions, and other schema definitions without inserting any data.
pg_restore \
  -U <username> \
  -h <host> \
  -p <port> \
  -d <database_name> \
  --schema-only \
  -v <backup_file>.dump
Partial restores work best with custom-format .dump files generated by pg_dump -Fc.
Common Errors & How to Fix Them
Errors during restore are often caused by permission issues, incorrect formats, or missing objects. Understanding the error messages and their causes will help you recover faster and avoid data loss.
1. Could not connect to database
pg_restore: [archiver] could not connect to databaseThis usually happens if the database doesn’t exist or the credentials are incorrect. Make sure the database has been created and the connection details are correct.
2. Permission denied for schema
ERROR: permission denied for schema publicThis error indicates that the user account used for restore lacks the privileges needed to write into the schema. Use a superuser account or adjust the schema permissions before restoring.
3. Input file appears to be a text format dump
pg_restore: error: input file appears to be a text format dumpThis means you are trying to use pg_restore a plain SQL file. In this case, you should use psql instead:
psql -U <username> -h <host> -p <port> -d <database_name> -f backup.sql4. Duplicate key value violates unique constraint
This occurs when the restore process tries to insert rows that already exist in the target database. You can either drop the target database before restoring or use --clean it in pg_restore to drop existing objects automatically.
Identifying Slow Queries
Slow queries can significantly affect application performance and user experience. PostgreSQL offers built-in tools to analyze and identify these slow operations. On Elestio, whether you’re connected via terminal, inside a Docker Compose container, or using PostgreSQL CLI tools, you can use several methods to pinpoint and fix performance issues. This guide walks through various techniques to identify slow queries, interpret execution plans, and apply optimizations.
Analyzing Slow Queries Using Terminal
When connected to your PostgreSQL service via terminal, you can use built-in tools like psql and SQL functions to observe how queries behave. This method is useful for immediate, ad hoc diagnostics in production or staging environments. You can use simple commands to view currently running queries, analyze individual query plans, and measure runtime performance. These steps help determine which queries are taking the most time and why.
Use psql to connect directly to your PostgreSQL instance. This provides access to administrative and diagnostic SQL commands.
psql -U <username> -h <host> -d <database>Now use the following command to show the query plan the database will use. It highlights whether PostgreSQL will perform a sequential scan, index scan, or other operation.
EXPLAIN SELECT * FROM orders WHERE customer_id = 42;Another type of command that executes the query and returns actual runtime and row counts. Comparing planned and actual rows helps determine if the planner is misestimating costs.
EXPLAIN ANALYZE SELECT * FROM orders WHERE customer_id = 42;Lastly, monitor queries in real time using the following command. This view lists all active queries, sorted by duration. It helps you identify queries that are taking too long and might need optimization.
SELECT pid, now() - query_start AS duration, query
FROM pg_stat_activity
WHERE state = 'active'
ORDER BY duration DESC;
Analyzing Slow Queries in Docker Compose Environments
If your PostgreSQL is deployed using Docker Compose on Elestio, you can inspect and troubleshoot slow queries from within the container. This method is useful when the PostgreSQL instance is isolated inside a container and not accessible directly from the host. Logs and query data can be collected from inside the service container using PostgreSQL tools or by checking configuration files.
docker-compose exec postgres bashThis command opens a shell inside the running PostgreSQL container. From here, you can run commands like psql or view logs. Use the same psql interface from inside the container to interact with the database and execute analysis commands.
psql -U $POSTGRES_USER -d $POSTGRES_DBNext, edit postgresql.conf inside the container to enable slow query logging:
log_min_duration_statement = 500
log_statement = 'none'
This setting logs all queries that take longer than 500 milliseconds. You may need to restart the container for these settings to take effect.
Using CLI Tools to Analyze Query Performance
PostgreSQL offers CLI-based tools and extensions like pg_stat_statements for long-term query performance analysis. These tools provide aggregated metrics over time, helping you spot frequently executed but inefficient queries. This section shows how to use PostgreSQL extensions and views to collect detailed statistics.
CREATE EXTENSION IF NOT EXISTS pg_stat_statements;This extension logs each executed query along with performance metrics such as execution time and row count. The next command shows the queries that have consumed the most total execution time. These are strong candidates for indexing or rewriting.
SELECT query, calls, total_time, mean_time, rows
FROM pg_stat_statements
ORDER BY total_time DESC
LIMIT 10;
Understanding Execution Plans and Metrics
PostgreSQL’s query planner produces execution plans that describe how a query will be executed. Reading these plans can help identify operations that slow down performance, such as full table scans or repeated joins. Comparing estimated and actual rows processed can also reveal outdated statistics or inefficient filters. Understanding these elements is key to choosing the right optimization strategy.
Key elements to understand:
-
Seq Scan: A full table scan; slow on large tables unless indexed.
-
Index Scan: Uses an index for fast lookup; typically faster than a sequential scan.
-
Cost: Estimated cost of the query, used by the planner to decide the best execution path.
-
Rows: Estimated vs. actual rows; large mismatches indicate bad planning or outdated stats.
-
Execution Time: Total time it took to run the query; from
EXPLAIN ANALYZE.
Use these metrics to compare how the query was expected to run versus how it actually performed.
Optimizing Queries for Better Performance
Once you’ve identified slow queries, the next step is to optimize them. Optimizations may involve adding indexes, rewriting SQL statements, or updating statistics. The goal is to reduce scan times, avoid redundant operations, and guide the planner to more efficient execution paths. Performance tuning is iterative—test after each change.
Common optimization steps:
-
Add indexes to columns used in WHERE, JOIN, and ORDER BY clauses.
-
Use EXPLAIN ANALYZE before and after changes to measure impact.
-
Avoid SELECT * to reduce data transfer and memory use.
-
Use LIMIT to restrict row output when only a subset is needed.
-
Run ANALYZE to update PostgreSQL's internal statistics and improve planner accuracy:
ANALYZE;By focusing on frequent and long-running queries, you can make improvements that significantly reduce overall load on the database.
Detect and terminate long-running queries
Long-running queries can significantly impact database performance by consuming CPU, memory, and I/O resources over extended periods. In production environments like Elestio, it’s important to monitor for these queries and take timely action to terminate them when necessary. PostgreSQL provides built-in monitoring tools and system views to help detect problematic queries and respond accordingly. This guide covers how to identify and cancel long-running queries using PostgreSQL’s terminal tools, Docker Compose environments, and logging features, along with preventive practices.
Identifying Long-Running Queries via Terminal
When connected to your PostgreSQL service through the terminal using psql, you can check which queries are running and how long they have been active. This can help identify queries that are stuck, inefficient, or blocked.
To list all active queries sorted by duration, you can use:
SELECT pid, now() - query_start AS duration, state, query
FROM pg_stat_activity
WHERE state = 'active'
ORDER BY duration DESC;
This query reveals which operations have been running the longest and their current state. If you want to isolate queries that have exceeded a specific duration (e.g., 1 minute), add a time filter:
SELECT pid, now() - query_start AS runtime, query
FROM pg_stat_activity
WHERE state = 'active' AND now() - query_start > interval '1 minute';
These queries help you locate potential performance bottlenecks in real time.
Terminating Long-Running Queries Safely
Once a problematic query is identified, PostgreSQL allows you to cancel it using the pid (process ID). If you want to cancel the query without affecting the client session, use:
SELECT pg_cancel_backend(<pid>);This tells PostgreSQL to stop the running query, but keep the session connected. If the query is unresponsive or the client is idle for too long, you can fully terminate the session using:
SELECT pg_terminate_backend(<pid>);This forcibly closes the session and stops the query. Termination should be used cautiously, especially in shared application environments.
Working Within Docker Compose Environments
If PostgreSQL is deployed using Docker Compose on Elestio, you can detect and manage queries from inside the container. Start by entering the container:
docker-compose exec postgres bashInside the container, connect to the database with:
psql -U $POSTGRES_USER -d $POSTGRES_DBFrom here, you can use the same commands as above to monitor and cancel long-running queries. The logic remains the same; you’re simply operating inside the container’s shell environment.
Using Logs and Monitoring Tools
PostgreSQL supports logging queries that exceed a certain duration threshold, which is useful for long-term monitoring and post-incident review. To enable this, modify your postgresql.conf file and set:
log_min_duration_statement = 500This setting logs every query that takes longer than 500 milliseconds. The logs are written to PostgreSQL’s log files, which you can access through the Elestio dashboard (if supported) or inside the container under the PostgreSQL data directory.
For cumulative insights, enable the pg_stat_statements extension to track long-running queries over time:
CREATE EXTENSION IF NOT EXISTS pg_stat_statements;Then query the collected data:
SELECT query, total_time, mean_time, calls
FROM pg_stat_statements
ORDER BY total_time DESC
LIMIT 10;
This shows which queries are consistently expensive, not just slow once.
Best Practices to Prevent Long-Running Queries
Preventing long-running queries is more effective than terminating them after the fact. Start by indexing columns used in WHERE, JOIN, and ORDER BY clauses. Use query analysis tools like EXPLAIN ANALYZE to find out how queries are executed and where performance issues may occur.
Also, consider setting timeouts for queries. At the session level, you can use:
SET statement_timeout = '2s';This automatically cancels any query that runs longer than 2 seconds. For applications, set timeout configurations in the client or ORM layer to ensure they don’t wait indefinitely on slow queries. Monitoring tools and alerts can help you detect abnormal query behavior early. If you’re managing your own monitoring stack, connect it to PostgreSQL logs or pg_stat_activity to trigger alerts for long-running operations.
Preventing Full Disk Issues
Running out of disk space in a database environment can lead to failed writes, service downtime, and even data corruption. PostgreSQL systems require available space not only for storing data but also for managing temporary files, WAL logs, indexes, and routine background tasks. On Elestio, while infrastructure is managed, you are still responsible for monitoring growth and preventing overuse. This guide outlines how to monitor disk usage, configure alerts, automate cleanup, and follow best practices to avoid full disk conditions in PostgreSQL.
Monitoring Disk Usage
Proactively monitoring disk usage helps you detect unusual growth in time to act. Whether you’re accessing your database directly via the terminal or through a Docker Compose environment, several built-in tools can provide usage stats and trends. Combining filesystem-level monitoring with PostgreSQL-specific checks gives a complete view of space utilization
To check the overall disk usage of the system from a terminal or container:
df -hThis command shows available space for each mounted volume. Focus on the mount point where your PostgreSQL data directory is stored, usually /var/lib/postgresql.
For detailed PostgreSQL-specific usage, connect to your database and run:
SELECT pg_size_pretty(pg_database_size(current_database()));This shows the total size used by the active database. You can also analyze individual tables and indexes using:
SELECT relname AS object, pg_size_pretty(pg_total_relation_size(relid)) AS size
FROM pg_catalog.pg_statio_user_tables
ORDER BY pg_total_relation_size(relid) DESC
LIMIT 10;
This query highlights the largest tables by size, helping you identify which parts of your schema consume the most space.
Configuring Alerts and Cleanup
Even with monitoring in place, automatic alerts and cleanup scripts ensure you act before hitting disk limits. You can set up external monitoring agents or run container-level scripts to track disk usage and notify you.
If you’re using Docker Compose, you can monitor container-level storage stats using:
docker system dfThis command provides an overview of Docker volumes, images, and container usage. To monitor and clean unused volumes and logs manually:
docker volume ls
docker volume rm <volume-name>
Make sure you’re not deleting active database volumes. Always verify that backups exist and are up-to-date before running cleanup commands.
To configure PostgreSQL-specific cleanup, enable auto-vacuum and monitor its effectiveness. PostgreSQL removes dead tuples and reclaims space using this process. Check the vacuum activity with:
SELECT relname, n_dead_tup, last_vacuum, last_autovacuum
FROM pg_stat_user_tables
ORDER BY n_dead_tup DESC;
If dead tuples accumulate, increase autovacuum frequency or run a manual vacuum:
VACUUM ANALYZE;Autovacuum settings can also be tuned in postgresql.conf to trigger more aggressively based on table activity.
Best Practices for Disk Space Management
- Beyond immediate cleanup, long-term strategies help keep disk usage under control. These include data retention policies, partitioning, compression, and regular maintenance. It’s also important to have a growth plan based on usage trends.
- Avoid storing large binary objects like images or PDFs directly in the database. Use object storage for large files and reference them by URL. If historical data is no longer needed for queries, archive it into a separate cold-storage database or export to files.
- Partition large tables by time or ID ranges to manage growth and make pruning easier. Use tools like
pg_partmannative PostgreSQL table partitioning to automatically offload older data - Regularly rotate and clean up PostgreSQL logs and WAL files. If using archive mode, ensure archived WALs are uploaded and removed from disk after successful backup.
- To keep your setup safe, also monitor backup file sizes and locations. Backups stored on the same volume as the database may consume critical space. If possible, push backups to remote object storage or another disk volume.
Checking Database Size and Related Issues
As your PostgreSQL database grows over time, it’s important to monitor its size and identify what parts of the database consume the most space. Unmanaged growth can lead to performance issues, disk exhaustion, and backup delays. On Elestio, where PostgreSQL is hosted in a managed environment, you can use SQL and command-line tools to measure database usage, analyze large objects, and troubleshoot storage problems. This guide explains how to check database size, detect bloated tables and indexes, and optimize storage usage efficiently.
Checking Database and Table Sizes
PostgreSQL provides built-in functions to report the size of the current database, its individual schemas, tables, and indexes. These functions are useful for understanding where most of your storage is being used and planning cleanup or archiving strategies.
To check the total size of the active database:
SELECT pg_size_pretty(pg_database_size(current_database()));This returns a human-readable value like “2 GB”, indicating how much space the entire database consumes on disk.
To list the largest tables in your schema:
SELECT relname AS table, pg_size_pretty(pg_total_relation_size(relid)) AS total_size
FROM pg_catalog.pg_statio_user_tables
ORDER BY pg_total_relation_size(relid) DESC
LIMIT 10;
This helps you identify which tables take up the most space, including indexes and TOAST (large field) data.
To break down table vs index size separately:
SELECT relname AS object,
       pg_size_pretty(pg_relation_size(relid)) AS table_size,
       pg_size_pretty(pg_indexes_size(relid)) AS index_size
FROM pg_catalog.pg_statio_user_tables
ORDER BY pg_relation_size(relid) DESC
LIMIT 10;
This distinction allows you to assess whether most space is used by raw table data or indexes, which can inform optimization decisions.
Identifying Bloat and Inefficiencies
Database bloat occurs when PostgreSQL retains outdated or deleted rows due to its MVCC model. This is common in high-write tables and can lead to wasted space and degraded performance. Bloated indexes and tables are often invisible unless explicitly checked. To estimate bloat at a table level, you can use a community query like this:
SELECT schemaname, relname, round(100 * (pg_total_relation_size(relid) - pg_relation_size(relid)) / pg_total_relation_size(relid), 2) AS bloat_pct
FROM pg_catalog.pg_statio_user_tables
ORDER BY bloat_pct DESC
LIMIT 10;
This query calculates how much of a table’s total size is not accounted for by its base data—higher percentages suggest unused or dead space. You can also check dead tuples directly:
SELECT relname, n_dead_tup
FROM pg_stat_user_tables
ORDER BY n_dead_tup DESC
LIMIT 10;
A high count of dead tuples suggests that autovacuum might not be keeping up and that a manual VACUUM could help.
Optimizing and Reducing Database Size
Once you’ve identified large or bloated objects, the next step is to optimize them. PostgreSQL offers tools like VACUUM, REINDEX, and CLUSTER to reclaim space and improve storage efficiency. These commands must be run with care to avoid locking critical tables during active hours. To reclaim dead tuples and update statistics:
VACUUM ANALYZE;This command removes dead rows and refreshes query planning statistics, which helps performance and frees up storage. To shrink large indexes that aren’t cleaned automatically, use:
REINDEX TABLE <table_name>;This recreates the table’s indexes from scratch and can free up disk space if indexes are fragmented or bloated. If a table is heavily bloated and full table rewrites are acceptable during maintenance, use:
CLUSTER <table_name>;This rewrites the entire table based on an index order and reclaims space similar to VACUUM FULL, but with more control.
Additionally, removing or archiving old data from large time-based tables can reduce total size. Consider partitioning large tables to manage this process more efficiently.