Redis
- Overview
- How to Connect
- Connecting with Node.js
- Connecting with Python
- Connecting with PHP
- Connecting with Go
- Connecting with Java
- Connecting with RedisInsight
- Connecting with redis-cli
- How-To Guides
- Creating a Database
- Upgrading to Major Version
- Installing and Updating an Extension
- Creating Manual Backups
- Restoring a Backup
- Identifying Slow Queries
- Detect and terminate long-running queries
- Preventing Full Disk Issues
- Checking Database Size and Related Issues
- Database Migration
- Cloning a Service to Another Provider or Region
- Database Migration Services for Redis
- Manual Redis Migration Using redis-cli and RDB Files
- Cluster Management
Overview
Redis is an open-source, in-memory key-value data store widely used as a database, cache, and message broker. Known for its high performance, Redis offers microsecond response times, making it ideal for real-time applications and high-throughput environments. It supports a variety of advanced data structures and provides features that enhance scalability, availability, and ease of development. Redis runs on multiple operating systems, including Linux, macOS, and Windows (via WSL or third-party builds).
Key Features of Redis:
- Performance and Scalability: Redis is an in-memory data store known for its exceptional speed and low latency, capable of handling millions of operations per second. It supports horizontal scaling via Redis Cluster and sharding for distributed environments.
- Persistence Options: Offers multiple persistence mechanisms, including point-in-time snapshots (RDB) and append-only file (AOF) logging, allowing users to balance performance and data durability based on application needs.
- Data Structures: Provides a rich set of data types beyond simple key-value pairs, including lists, sets, hashes, sorted sets, bitmaps, and hyperloglogs, enabling efficient and versatile data modeling.
- Pub/Sub Messaging: Supports publish/subscribe messaging patterns, making it suitable for building real-time messaging and notification systems.
- High Availability and Replication: Features master-replica replication and automatic failover with Redis Sentinel, ensuring high availability, data redundancy, and minimal downtime during failures.
- Security Features: Includes authentication, access control lists (ACLs), and SSL/TLS support to safeguard access and communication between clients and the Redis server.
- Modules and Extensibility: Supports a modular architecture allowing the addition of custom capabilities like RediSearch, RedisJSON, and RedisGraph, enhancing its functionality for specific use cases.
- Cross-Platform Support: Runs on major operating systems including Linux, macOS, and Windows (via WSL or third-party builds), offering deployment flexibility across different platforms.
- Ease of Use and Tooling: Comes with a simple command-line interface, client libraries for many programming languages, and monitoring tools like RedisInsight, facilitating easy integration, debugging, and performance tuning.
These features make Redis a powerful and flexible solution for developers and organizations seeking ultra-fast, scalable, and real-time data processing capabilities.
How to Connect
Connecting with Node.js
This guide explains how to establish a connection between a Node.js application and a Redis database using the redis package. It walks through the necessary setup, configuration, and execution of a simple Redis command.
Variables
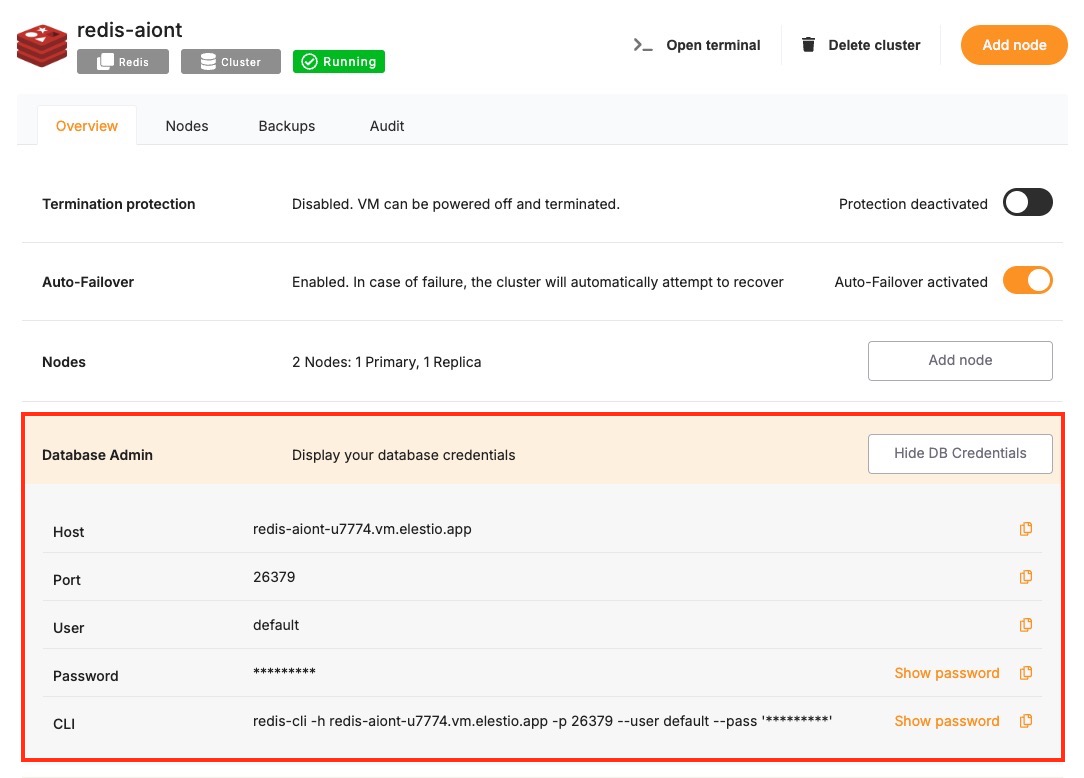
To successfully connect to a Redis instance, you’ll need to provide the following parameters. These can typically be found on the Elestio service overview page.
|
Variable |
Description |
Purpose |
|---|---|---|
|
|
Redis hostname (from Elestio service overview) |
The address of the server hosting your Redis instance. |
|
|
Redis port (from Elestio service overview) |
The port used for the Redis connection. The default Redis port is 6379. |
|
|
Redis password (from Elestio service overview) |
Authentication key used to connect securely to the Redis instance. |
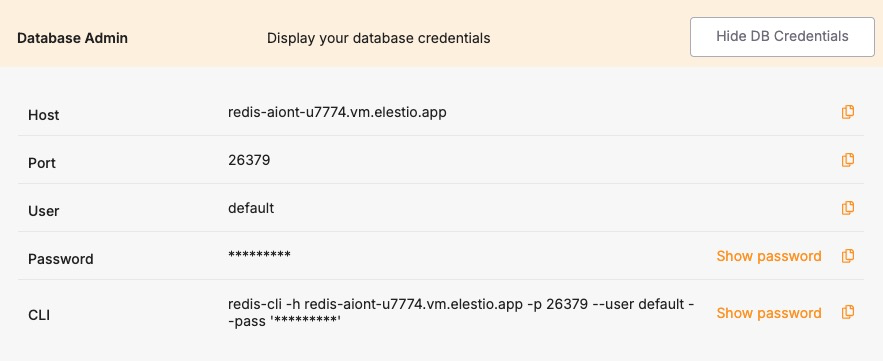
These values can usually be found in the Elestio service overview details as shown in the image below, make sure to take a copy of these details and add it to the code moving ahead.
Prerequisites
Install Node.js and NPM
-
Check if Node.js is installed by running:
node -v-
If not installed, download and install it from nodejs.org.
-
Confirm npm is installed by running:
npm -vInstall the redis Package
The redis package enables communication between Node.js applications and Redis.
npm install redis --saveCode
Create a new file named redis.js and add the following code:
const redis = require("redis");

// Redis connection configuration
const config = {
  socket: {
    host: "HOST",
    port: PORT,
  },
  password: "PASSWORD",
};

// Create a Redis client
const client = redis.createClient(config);

// Handle connection errors
client.on("error", (err) => {
  console.error("Redis connection error:", err);
});

// Connect and run a test command
(async () => {
  try {
    await client.connect();
    console.log("Connected to Redis");

    // Set and retrieve a test key
    await client.set("testKey", "Hello Redis");
    const value = await client.get("testKey");
    console.log("Retrieved value:", value);

    // Disconnect from Redis
    await client.disconnect();
  } catch (err) {
    console.error("Redis operation failed:", err);
  }
})();
To execute the script, open the terminal or command prompt and navigate to the directory where redis.js is located. Once in the correct directory, run the script with the command:
node redis.jsIf the connection is successful, the output should resemble:
Connected to Redis
Retrieved value: Hello RedisConnecting with Python
This guide explains how to connect a Python application to a Redis database using the redis library. It walks through the required setup, configuration, and execution of a simple Redis command.
Variables
To connect to Redis, the following parameters are needed. You can find these values in the Elestio Redis service overview.
|
Variable |
Description |
Purpose |
|---|---|---|
|
|
Redis hostname (from Elestio service overview) |
Address of the Redis server. |
|
|
Redis port (from Elestio service overview) |
Port used to connect to Redis. The default is 6379. |
|
|
Redis password (from Elestio service overview) |
Authentication credential for the Redis connection. |
These values can usually be found in the Elestio service overview details as shown in the image below, make sure to take a copy of these details and add it to the code moving ahead.
Prerequisites
Install Python and pip
-
Check if Python is installed by running:
python3 --version-
If not installed, download and install it from python.org.
-
Check pip (Python package installer):
pip --versionInstall the redis Package
Install the official redis library using pip:
pip install redisCode
Create a file named redis.py and paste the following code:
import redis

config = {
    "host": "HOST",
    "port": PORT,  # Example: 6379
    "password": "PASSWORD",
    "decode_responses": True
}

try:
    client = redis.Redis(**config)
    client.set("testKey", "Hello Redis")
    value = client.get("testKey")
    print("Connected to Redis")
    print("Retrieved value:", value)

except redis.RedisError as err:
    print("Redis connection or operation failed:", err)
To execute the script, open the terminal or command prompt and navigate to the directory where redis.py is located. Once in the correct directory, run the script with the command:
python3 redis.pyIf everything is set up correctly, the output will be:
Connected to Redis
Retrieved value: Hello RedisConnecting with PHP
This guide explains how to establish a connection between a PHP application and a Redis database using the phpredis extension. It walks through the necessary setup, configuration, and execution of a simple Redis command.
Variables
Certain parameters must be provided to establish a successful connection to a Redis database. Below is a breakdown of each required variable, its purpose, and where to find it. Here’s what each variable represents:
|
Variable |
Description |
Purpose |
|---|---|---|
|
|
Redis hostname, from the Elestio service overview page |
The address of the server hosting your Redis instance. |
|
|
Port for Redis connection, from the Elestio service overview page |
The network port used to connect to Redis. The default port is 6379. |
|
|
Redis password, from the Elestio service overview page |
The authentication key required to connect securely to Redis. |
These values can usually be found in the Elestio service overview details as shown in the image below. Make sure to take a copy of these details and add it to the code moving ahead.
Prerequisites
- Install PHP
- Check if PHP is installed by running:
php -v-
- If not installed, download it from php.net and install.
- Install the phpredis Extension
- The phpredis extension provides a native PHP interface for Redis. You can install it using:
sudo pecl install redis-
- Then enable it in your php.ini:
extension=redis-
- To verify it’s installed:
php -m | grep redisCode
Once all prerequisites are set up, create a new file named redis.php and add the following code:
<?php

$host = 'HOST';
$port = PORT;
$password = 'PASSWORD';

$redis = new Redis();

try {
    $redis->connect($host, $port);

    if (!$redis->auth($password)) {
        throw new Exception('Authentication failed');
    }

    echo "Connected to Redis\n";

    $redis->set("testKey", "Hello Redis");
    $value = $redis->get("testKey");
    echo "Retrieved value: $value\n";

    $redis->close();

} catch (Exception $e) {
    echo "Redis connection or operation failed: " . $e->getMessage() . "\n";
}
Open the terminal or command prompt and navigate to the directory where redis.php is located. Once in the correct directory, run the script with the command:
php redis.phpIf the connection is successful, the terminal will display output similar to:
Connected to Redis
Retrieved value: Hello RedisConnecting with Go
This guide explains how to establish a connection between a Go application and a Redis database using the go-redis package. It walks through the necessary setup, configuration, and execution of a simple Redis command.
Variables
Certain parameters must be provided to establish a successful connection to a Redis database. Below is a breakdown of each required variable, its purpose, and where to find it. Here’s what each variable represents:
|
Variable |
Description |
Purpose |
|---|---|---|
|
|
Redis hostname, from the Elestio service overview page |
The address of the server hosting your Redis instance. |
|
|
Port for Redis connection, from the Elestio service overview page |
The network port used to connect to Redis. The default port is 6379. |
|
|
Redis password, from the Elestio service overview page |
The authentication key required to connect securely to Redis. |
These values can usually be found in the Elestio service overview details as shown in the image below, make sure to take a copy of these details and add it to the code moving ahead.
Prerequisites
Install Go
Check if Go is installed by running:
go versionIf not installed, download it from golang.org and install.
Install the go-redis Package
The go-redis package enables Go applications to interact with Redis. Install it using:
go get github.com/redis/go-redis/v9Code
Once all prerequisites are set up, create a new file named redis.go and add the following code:
package main

import (
	"context"
	"fmt"
	"time"

	"github.com/redis/go-redis/v9"
)

func main() {
	opt := &redis.Options{
		Addr:     "HOST:PORT",
		Password: "PASSWORD",
		DB:       0,
	}

	rdb := redis.NewClient(opt)
	ctx, cancel := context.WithTimeout(context.Background(), 5*time.Second)
	defer cancel()

	err := rdb.Set(ctx, "testKey", "Hello Redis", 0).Err()
	if err != nil {
		fmt.Println("Redis operation failed:", err)
		return
	}

	val, err := rdb.Get(ctx, "testKey").Result()
	if err != nil {
		fmt.Println("Redis operation failed:", err)
		return
	}

	fmt.Println("Connected to Redis")
	fmt.Println("Retrieved value:", val)

	if err := rdb.Close(); err != nil {
		fmt.Println("Error closing connection:", err)
	}
}
To execute the script, open the terminal or command prompt and navigate to the directory where redis.go is located. Once in the correct directory, run the script with the command:
go run redis.goIf the connection is successful, the terminal will display output similar to:
Connected to Redis
Retrieved value: Hello RedisConnecting with Java
This guide explains how to establish a connection between a Java application and a Redis database using the Jedis library. It walks through the necessary setup, configuration, and execution of a simple Redis command.
Variables
Certain parameters must be provided to establish a successful connection to a Redis database. Below is a breakdown of each required variable, its purpose, and where to find it. Here’s what each variable represents:
|
Variable |
Description |
Purpose |
|---|---|---|
|
|
Redis hostname, from the Elestio service overview page |
The address of the server hosting your Redis instance. |
|
|
Port for Redis connection, from the Elestio service overview page |
The network port used to connect to Redis. The default port is 6379. |
|
|
Redis password, from the Elestio service overview page |
The authentication key required to connect securely to Redis. |
These values can usually be found in the Elestio service overview details as shown in the image below, make sure to take a copy of these details and add it to the code moving ahead.
Prerequisites
Install Java
Check if Java is installed by running:
java -versionIf not installed, download it from oracle.com and install.
Download Jedis and Dependencies
The Jedis library enables Java applications to interact with Redis. You need to download two JAR files manually:
-
Jedis JAR (Jedis 5.1.0):
https://repo1.maven.org/maven2/redis/clients/jedis/5.1.0/jedis-5.1.0.jar
-
Apache Commons Pool2 JAR (Required by Jedis):
https://repo1.maven.org/maven2/org/apache/commons/commons-pool2/2.11.1/commons-pool2-2.11.1.jar
Place both JAR files in the same directory as your Java file.
Code
Once all prerequisites are set up, create a new file named RedisTest.java and add the following code:
import redis.clients.jedis.JedisPooled;

public class RedisTest {
    public static void main(String[] args) {
        // Redis connection configuration
        String host = "HOST";
        int port = PORT; // e.g., 6379
        String password = "PASSWORD";

        // Create a Redis client
        JedisPooled jedis = new JedisPooled(host, port, password);

        try {
            // Set and get a test key
            jedis.set("testKey", "Hello Redis");
            String value = jedis.get("testKey");

            System.out.println("Connected to Redis");
            System.out.println("Retrieved value: " + value);

        } catch (Exception e) {
            System.out.println("Redis connection or operation failed: " + e.getMessage());
        }
    }
}
To execute the script, open the terminal or command prompt and navigate to the directory where RedisTest.java is located. Once in the correct directory, run the following commands:
On Linux/macOS :
javac -cp "jedis-5.1.0.jar:commons-pool2-2.11.1.jar" RedisTest.java
java -cp ".:jedis-5.1.0.jar:commons-pool2-2.11.1.jar" RedisTest
On Windows :
javac -cp "jedis-5.1.0.jar;commons-pool2-2.11.1.jar" RedisTest.java
java -cp ".;jedis-5.1.0.jar;commons-pool2-2.11.1.jar" RedisTest
If the connection is successful, the terminal will display output similar to:
Connected to Redis
Retrieved value: Hello RedisConnecting with RedisInsight
This guide explains how to establish a connection between RedisInsight and a Redis database instance. It walks through the necessary setup, configuration, and connection steps using the official Redis GUI.
Variables
Certain parameters must be provided to establish a successful connection to a Redis database. Below is a breakdown of each required variable, its purpose, and where to find it. Here’s what each variable represents:
|
Variable |
Description |
Purpose |
|---|---|---|
|
|
Redis hostname, from the Elestio service overview page |
The address of the server hosting your Redis instance. |
|
|
Port for Redis connection, from the Elestio service overview page |
The network port used to connect to Redis. The default port is 6379. |
|
|
Redis password, from the Elestio service overview page |
The authentication key required to connect securely to Redis. |
These values can usually be found in the Elestio service overview details as shown in the image below, make sure to take a copy of these details and add it to the tool moving ahead.
Prerequisites
Install RedisInsight
RedisInsight is a graphical tool for managing Redis databases. Download and install RedisInsight from:
https://redis.com/redis-enterprise/redis-insight/
RedisInsight is available for Windows, macOS, and Linux.
Steps
Once all prerequisites are set up, follow these steps to connect:
-
Launch RedisInsight
Open the RedisInsight application after installation.
-
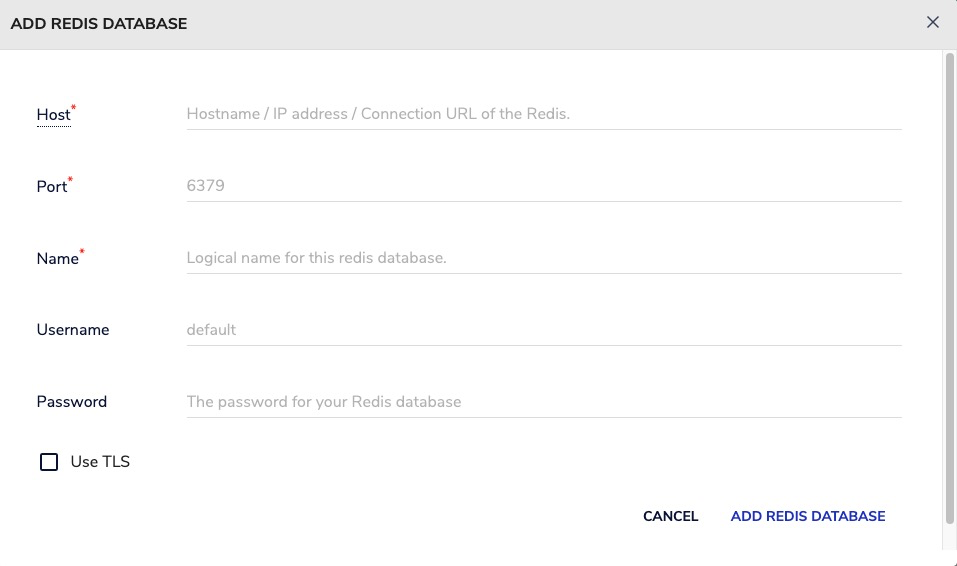
Add a New Redis Database
Click on “Add Redis Database”.
-
Enter Your Connection Details
Fill in the following fields using your Elestio Redis service information:
-
Host: HOST
-
Port: PORT
-
Password: PASSWORD

-
-
Test and Save the Connection
Click on “Test Connection” to verify the details. If successful, click “Connect” or “Add Database”.
If the connection is successful, RedisInsight will display a dashboard showing key metrics, data structures, memory usage, and allow you to interact directly with Redis using a built-in CLI or visual browser.
Connecting with redis-cli
This guide explains how to establish a connection between redis-cli and a Redis database instance. It walks through the necessary setup, configuration, and execution of a simple Redis command from the terminal.
Variables
Certain parameters must be provided to establish a successful connection to a Redis database. Below is a breakdown of each required variable, its purpose, and where to find it. Here’s what each variable represents:
|
Variable |
Description |
Purpose |
|---|---|---|
|
|
Redis hostname, from the Elestio service overview page |
The address of the server hosting your Redis instance. |
|
|
Port for Redis connection, from the Elestio service overview page |
The network port used to connect to Redis. The default port is 6379. |
|
|
Redis password, from the Elestio service overview page |
The authentication key required to connect securely to Redis. |
These values can usually be found in the Elestio service overview details as shown in the image below, make sure to take a copy of these details and use them in the command moving ahead.
Prerequisites
Install redis-cli
Check if redis-cli is installed by running:
redis-cli --versionIf not installed, you can install it via:
-
macOS:
brew install redis-
Ubuntu/Debian:
sudo apt install redis-tools-
Windows:
Use Windows Subsystem for Linux (WSL) or download a Redis CLI binary.
Command
Once all prerequisites are set up, open the terminal or command prompt and run the following command:
redis-cli -h HOST -p PORT -a PASSWORDReplace HOST, PORT, and PASSWORD with the actual values from your Elestio Redis service. If the connection is successful, the terminal will display a Redis prompt like this:
HOST:PORT>You can then run a simple command to test the connection:
set testKey "Hello Redis"
get testKey
Expected output:
"Hello Redis"If the connection is successful, the terminal will display output similar to:
"Hello Redis"How-To Guides
Creating a Database
Redis is a popular in-memory key-value data store known for its speed, flexibility, and support for a wide range of data structures. Setting up Redis properly is essential to ensure high availability, data persistence, and performance in modern applications. This guide walks through different ways to run and connect to Redis: using the Redis CLI, using Docker containers, and using Redis CLI tools. It also emphasizes best practices that should be followed at each step.
Creating Using redis-cli
The Redis command-line interface (redis-cli) is a built-in tool that allows direct interaction with a Redis server. It supports connecting to local or remote Redis instances and executing all supported Redis commands interactively or non-interactively.
Connect to Redis:
If you’re running Redis locally (e.g., from a system package or Docker container on your machine), you can simply run the CLI tool with no arguments:
redis-cliFor remote connections, you need to provide the hostname or IP address, the port number (default is 6379), and the password if the instance is protected:
redis-cli -h <host> -p <port> -a <password>You’ll be dropped into the Redis shell, where commands can be executed directly.
Running Redis Using Docker
Docker is a widely-used tool for running applications in isolated environments called containers. Redis can be deployed in a container for fast and consistent setup across different environments, making it ideal for both development and production.
Access Elestio Terminal
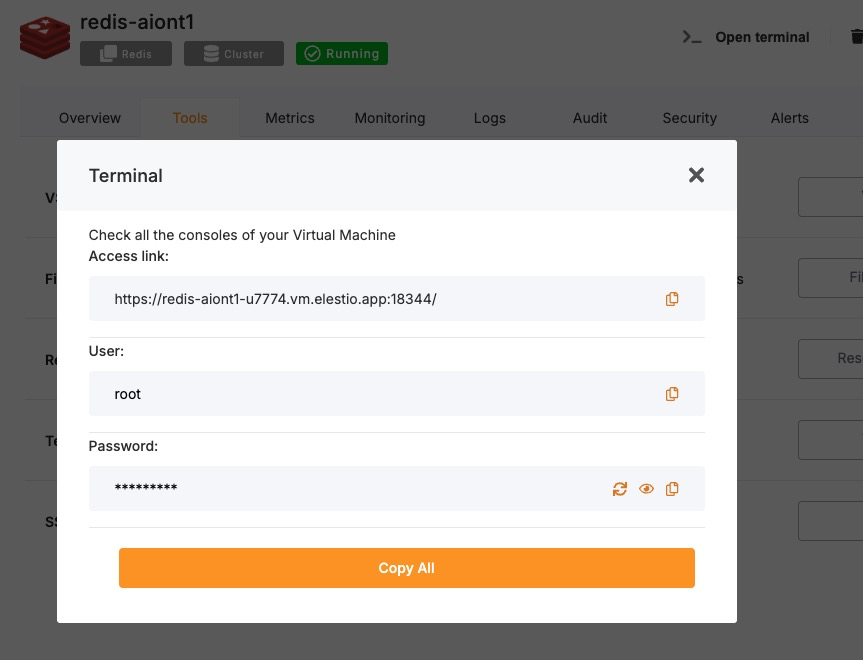
If you’re using Elestio for your Redis deployment, log into the Elestio dashboard. Go to your Redis service, then navigate to Tools > Terminal. This opens a browser-based terminal already configured for the correct environment.
Once in the terminal, change the directory to the project root where the Docker services are defined. This is typically:
cd /opt/app/Access the Redis Container Shell
Elestio services are managed using Docker Compose, which orchestrates multiple containers. To enter the Redis container’s shell and run Redis commands, use the following:
docker-compose exec redis bashThis command opens a shell inside the running Redis container.
Access Redis CLI from Within the Container
Inside the Redis container, the redis-cli command is already available. Use it to access the Redis instance. If authentication is enabled, supply the password using the -a flag:
redis-cli -a <password>You will be connected directly to the Redis server running inside the container.
Test Connectivity
Use a simple SET command to store a value and then retrieve it using GET to ensure Redis is functioning properly:
set testkey "Hello Redis"
get testkey
Expected output:
"Hello Redis"This verifies read/write operations are working as expected.
Connecting Using redis-cli in Scripts
redis-cli isn’t just for interactive use — it can also be used within shell scripts and automated pipelines. This is useful for deployment tasks, monitoring scripts, and health checks.
For example, to set a key from a script or cron job:
redis-cli -h <host> -p <port> -a <password> SET example_key "example_value"This command connects to the Redis server and sets the specified key in a single line, suitable for automation.
Best Practices for Setting Up Redis
Use Meaningful Key Naming Conventions
Organizing your Redis data is essential for maintainability and clarity. Use descriptive keys and adopt a namespace-style format using colons (:) to group related keys:
user:1001:profile
order:2023:total
This makes it easier to debug, analyze, and migrate data in the future.
Follow Consistent Data Structures
Redis supports multiple data types: strings, hashes, lists, sets, and sorted sets. Choose the most appropriate structure for your use case, and apply it consistently. For example, use hashes to store user attributes and lists for ordered items.
Inconsistent or incorrect use of data structures can lead to performance issues and logic errors.
Enable Authentication and TLS
Security is critical in production environments. Always set a strong password using the requirepass directive in redis.conf, and consider enabling TLS for encrypted communication if Redis is exposed over a network.
Example redis.conf settings:
requirepass strong_secure_password
tls-port 6379
tls-cert-file /path/to/cert.pem
tls-key-file /path/to/key.pem
This helps prevent unauthorized access and secures data in transit.
Configure Persistence Options
Redis is in-memory, but it supports two main persistence options:
-
RDB (snapshotting): takes periodic snapshots of the data.
-
AOF (Append Only File): logs each write operation for more durable persistence.
Set these options in redis.conf:
save 900 1
appendonly yes
appendfsync everysec
Use AOF for durability and RDB for faster restarts — or combine both for a balance.
Monitor and Tune Performance
Use Redis’s built-in tools (INFO, MONITOR, SLOWLOG) to analyze behavior, identify slow queries, and monitor memory usage. This helps maintain performance and plan for scaling.
External tools like RedisInsight, Prometheus, or Grafana can visualize metrics and alert on anomalies.
Common Issues and Their Solutions
|
Issue |
Cause |
Solution |
|---|---|---|
|
NOAUTH Authentication required. |
Connecting to a password-protected Redis without a password |
Use the -a <password> flag or the AUTH command before other commands |
|
ERR Client sent AUTH, but no password is set |
The Redis server does not require a password |
Remove the -a flag or check requirepass in redis.conf |
|
Can’t connect to Redis on ‘localhost’ |
Redis is not running or using the wrong port |
Start Redis and check redis.conf or Docker port mappings |
|
Docker Redis container refuses connections |
Container is not ready or misconfigured network |
Check logs using docker-compose logs redis and verify port exposure |
|
Data not persisted after restart |
Persistence settings are disabled |
Enable AOF or RDB in redis.conf |
Upgrading to Major Version
Upgrading a database service on Elestio can be done without creating a new instance or performing a full manual migration. Elestio provides a built-in option to change the database version directly from the dashboard. This is useful for cases where the upgrade does not involve breaking changes or when minimal manual involvement is preferred. The version upgrade process is handled by Elestio internally, including restarting the database service if required. This method reduces the number of steps involved and provides a way to keep services up to date with minimal configuration changes.
Log In and Locate Your Service
To begin the upgrade process, log in to your Elestio dashboard and navigate to the specific database service you want to upgrade. It is important to verify that the correct instance is selected, especially in environments where multiple databases are used for different purposes such as staging, testing, or production. The dashboard interface provides detailed information for each service, including version details, usage metrics, and current configuration. Ensure that you have access rights to perform upgrades on the selected service. Identifying the right instance helps avoid accidental changes to unrelated environments.
Back Up Your Data
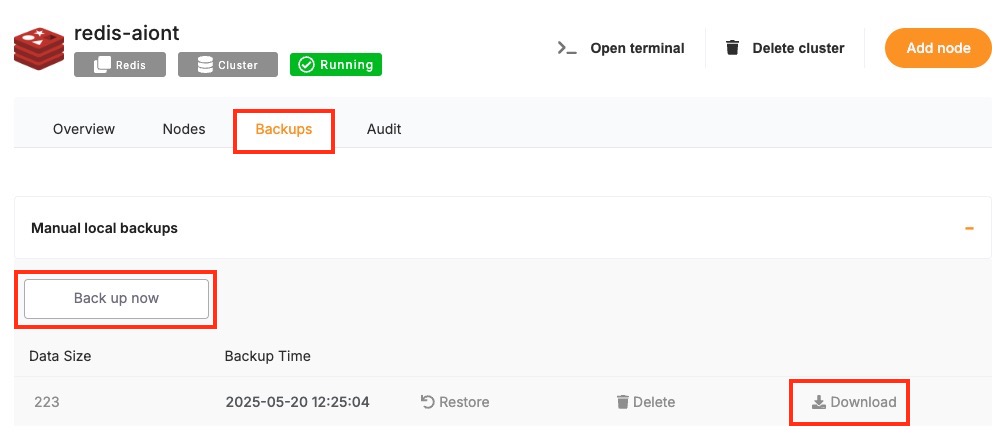
Before starting the upgrade, create a backup of your database. A backup stores the current state of your data, schema, indexes, and configuration, which can be restored if something goes wrong during the upgrade. In Elestio, this can be done through the Backups tab by selecting Back up now under Manual local backups and Download the backup file. Scheduled backups may also be used, but it is recommended to create a manual one just before the upgrade. Keeping a recent backup allows quick recovery in case of errors or rollback needs. This is especially important in production environments where data consistency is critical.
Select the New Version
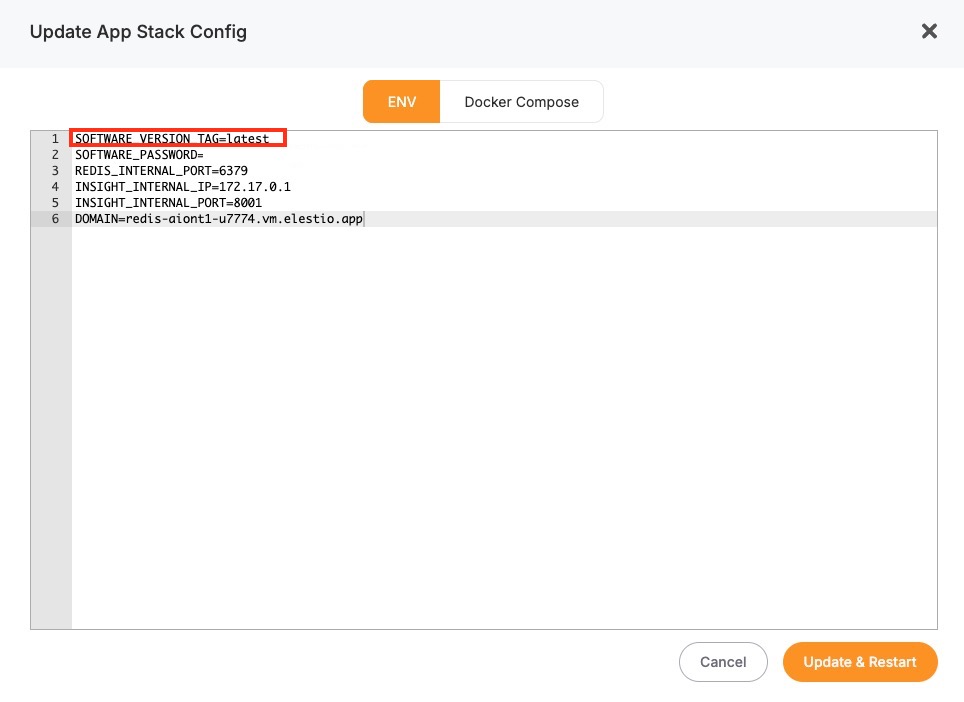
Once your backup is secure, proceed to the Overview and then Software > Update config tab within your database service page.
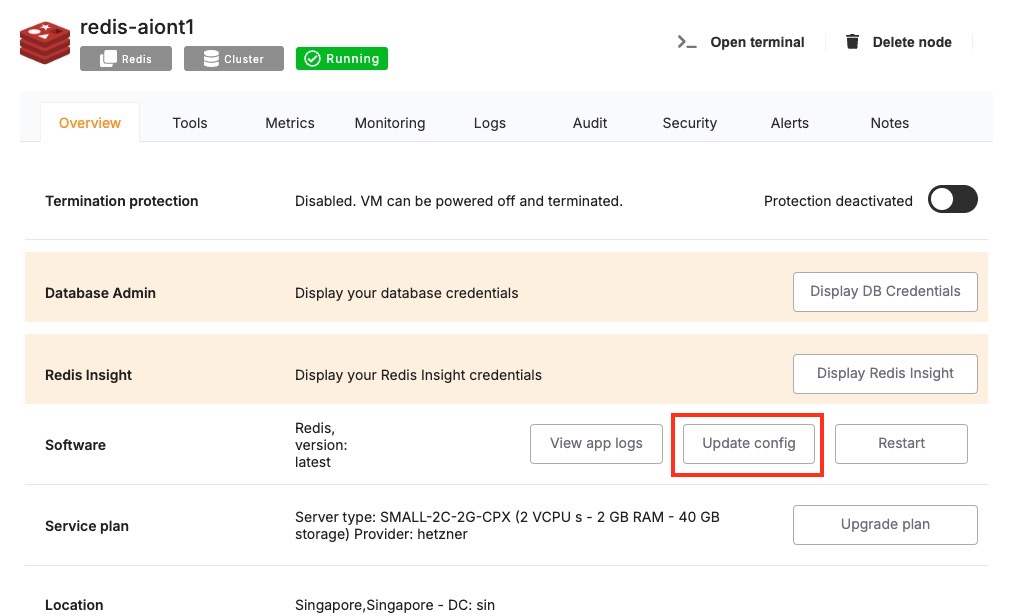
Here, you'll find an option labeled ENV. In the ENV menu, change the desired database version to SOFTWARE_VERSION. After confirming the version, Elestio will begin the upgrade process automatically. During this time, the platform takes care of the version change and restarts the database if needed. No manual commands are required, and the system handles most of the operational aspects in the background.
Monitor the Upgrade Process
The upgrade process may include a short downtime while the database restarts. Once it is completed, it is important to verify that the upgrade was successful and the service is operating as expected. Start by checking the logs available in the Elestio dashboard for any warnings or errors during the process. Then, review performance metrics to ensure the database is running normally and responding to queries. Finally, test the connection from your client applications to confirm that they can interact with the upgraded database without issues.
Installing and Updating an Extension
Redis supports modules to extend core functionality with new data types, commands, or algorithms. These modules behave like plugins in other systems and are loaded at server startup. Examples include RedisBloom, RedisTimeSeries, RedisJSON, and RedisSearch.
In Elestio-hosted Redis instances or any Docker Compose-based setup, modules can be loaded by specifying them in the service configuration. This guide walks through how to install, load, and manage Redis modules using Docker Compose, along with common issues and best practices.
Installing and Enabling Redis Modules
Redis modules are typically compiled as shared object (.so) files and must be loaded at server startup using the --loadmodule option. These module files are mounted into the container and referenced from within the container’s file system. To use a module like RedisBloom in a Docker Compose setup:
Update docker-compose.yml
Mount the module file into the container and load it:
services:
  redis:
    image: redis/redis-stack-server:latest
    volumes:
      - ./modules/redisbloom.so:/data/redisbloom.so
    command: ["redis-server", "--loadmodule", "/data/redisbloom.so"]
    ports:
      - "6379:6379"
Here:
-
./modules/redisbloom.sois the local path on your host machine. -
/data/redisbloom.sois the path inside the container.
Make sure the .so file exists in the specified directory before running Docker Compose.
Restart the Redis Service
After updating the Compose file, restart the service:
docker-compose down
docker-compose up -d
This will reload Redis with the specified module.
Verify the Module is Loaded
Once Redis is running, connect to it using redis-cli:
docker-compose exec redis redis-cli -a <yourPassword>Run the following command:
MODULE LISTExpected output:
1) 1) "name"
   2) "bf"
   3) "ver"
   4) (integer) 20207
This confirms the module (in this case, bf for RedisBloom) is loaded and active.
Checking Module Availability & Compatibility
Redis modules must match the Redis server version and platform. You can verify compatibility through the module’s documentation or by testing it in a local development setup before using it in production.
To inspect module-related details:
INFO MODULESTo verify the correct Redis image is being used:
docker-compose exec redis redis-server --versionIf a module fails to load, check the container logs:
docker-compose logs redisThis often reveals missing paths or compatibility issues.
Updating or Unloading Modules
Unlike MySQL, Redis does not support dynamic unloading of modules once loaded. To update or remove a module:
-
Stop the container:
docker-compose down-
Edit docker-compose.yml:
-
Change the .so file path if updating the module.
-
Remove the
--loadmoduleline if unloading the module.
-
-
Restart the container:
docker-compose up -dAlways test updated modules in staging before applying to production.
Troubleshooting Common Module Issues
|
Issue |
Cause |
Resolution |
|---|---|---|
|
Redis fails to start |
Incorrect module path or incompatible binary |
Check docker-compose logs redis and verify the .so path and architecture |
|
MODULE command not recognized |
Using a Redis image without module support |
Use an image like redis/redis-stack-server which supports modules |
|
“Can’t open .so file” |
Volume not mounted or permission denied |
Ensure the .so file exists locally and is readable by Docker |
|
Module not appearing in MODULE LIST |
Module failed to load silently |
Double-check command and container logs |
|
Commands from the module not recognized |
Module not loaded properly or incompatible |
Validate Redis version and module compatibility |
Security Considerations
Redis modules execute native code with the same privileges as Redis itself. Only load trusted, vetted modules from official sources. Avoid uploading or executing arbitrary .so files from unknown authors. In multi-tenant or exposed environments, module misuse could lead to instability or security risks. Ensure the redis user inside the container has limited privileges, and module directories have appropriate permissions.
Creating Manual Backups
Regular backups are essential when running a Redis deployment especially if you’re using it for persistent data. While Elestio handles automated backups by default, you may want to create manual backups before configuration changes, retain a local archive, or test backup automation. This guide walks through multiple methods for creating Redis backups on Elestio, including dashboard snapshots, command-line approaches, and Docker Compose-based setups. It also explains backup storage, retention, and automation using scheduled jobs.
Manual Service Backups on Elestio
If you’re using Elestio’s managed Redis service, the simplest way to perform a full backup is directly through the Elestio dashboard. This creates a snapshot of your current Redis dataset and stores it in Elestio’s infrastructure. These snapshots can be restored later from the same interface, which is helpful when making critical changes or testing recovery workflows.
To trigger a manual Redis backup on Elestio:
-
Log in to the Elestio dashboard.
-
Navigate to your Redis service or cluster.
-
Click the Backups tab in the service menu.
-
Choose Back up now to generate a manual snapshot.
This method is recommended for quick, reliable backups without needing to use the command line.
Manual Backups Using Docker Compose
If your Redis instance is deployed via Docker Compose (as is common on Elestio-hosted environments), you can manually back up Redis by copying its internal snapshot files. Redis persistence is managed through RDB (Redis Database) and optionally AOF (Append-Only File) logs, both of which reside in the container’s filesystem.
Access Elestio Terminal
Go to your deployed Redis service in the Elestio dashboard, navigate to Tools > Terminal, and log in using the credentials provided.
Locate the Redis Container Directory
cd /opt/app/This is the working directory of your Docker Compose project, which contains the docker-compose.yml file.
Trigger an RDB Snapshot (Optional)
Redis typically saves snapshots automatically based on configuration, but you can force one manually:
docker-compose exec redis redis-cli SAVEThis command triggers an immediate snapshot. The resulting file is usually called dump.rdb.
Copy Backup Files from the Container
Use docker cp to copy the snapshot file (and optionally the AOF file, if enabled) from the container to your host system:
docker cp $(docker-compose ps -q redis):/data/dump.rdb ./backup_$(date +%F).rdbIf AOF persistence is also enabled (via appendonly yes in redis.conf), back up the AOF log as well:
docker cp $(docker-compose ps -q redis):/data/appendonly.aof ./appendonly_$(date +%F).aofThis gives you complete Redis data snapshots for storage or future recovery.
Backup Storage & Retention Best Practices
After creating backups, it’s important to store them securely and manage retention properly. Redis backups are binary files and can be quite compact (RDB) or larger and more frequent (AOF), depending on configuration.
Guidelines to Follow:
-
Use clear naming:
redis_backup_2025_05_19.rdb -
Store off-site or on cloud storage (e.g. AWS S3, Backblaze, encrypted storage).
-
Retain: 7 daily backups, 4 weekly backups, and 3–6 monthly backups.
-
Automate old file cleanup with cron jobs or retention scripts.
-
Optionally compress backups with gzip or xz to reduce space.
Automating Redis Backups (cron)
Manual backup commands can be scheduled using tools like cron on Linux-based systems. This allows you to regularly back up your database without needing to run commands manually. Automating the process also reduces the risk of forgetting backups and ensures more consistent retention.
Example: Daily Backup at 3 AM
-
Edit the crontab:
crontab -e-
Add a job like:
0 3 * * * docker-compose -f /opt/app/docker-compose.yml exec redis redis-cli SAVE && \
docker cp $(docker-compose -f /opt/app/docker-compose.yml ps -q redis):/data/dump.rdb /backups/redis_backup_$(date +\%F).rdb
Make sure /backups/ exists and is writable by the cron user.
You can also compress the file or upload to cloud storage in the same script:
gzip /backups/redis_backup_$(date +\%F).rdb
rclone copy /backups/remote-dir/ remote:redis-backups
Backup Format and Restore Notes
|
Format |
Description |
Restore Method |
|---|---|---|
|
|
Binary snapshot of full dataset |
Stop Redis, replace dump.rdb, then restart Redis |
|
|
Append-only command log |
Stop Redis, replace AOF file, then restart Redis |
To restore from a backup:
-
Stop Redis (docker-compose down)
-
Replace the corresponding file in the volumes or /data directory.
-
Restart Redis (docker-compose up -d)
Restoring a Backup
Restoring Redis backups is essential for disaster recovery, staging environment duplication, or rolling back to a known state. Elestio supports backup restoration both through its web dashboard and manually through Docker Compose and command-line methods. This guide explains how to restore Redis backups from RDB or AOF files, covering both full and partial restore scenarios, and includes solutions for common restoration issues.
Restoring from a Backup via Terminal
This method applies when you have an RDB (dump.rdb) or AOF (appendonly.aof) file from a previous backup. To restore the backup, you replace the existing Redis data file(s) inside the data directory used by the container. Redis loads this data at startup, making it essential to stop the server before replacing the files.
Stop the Redis Container
Shut down the Redis container cleanly to avoid file corruption:
docker-compose downReplace the Backup File
Move your backup file into the appropriate location inside the Redis volume. Assuming you have a backup named backup_2025_05_19.rdb:
cp ./backup_2025_05_19.rdb /opt/app/data/dump.rdbMake sure this file path corresponds to the volume used in your docker-compose.yml. For example:
volumes:
  - ./data:/data
If you’re restoring an AOF file, replace appendonly.aof instead:
cp ./appendonly_2025_05_19.aof /opt/app/data/appendonly.aofRestart Redis
Start Redis again so it loads the restored data file:
docker-compose up -dRedis will automatically load dump.rdb or appendonly.aof depending on your configuration (set in redis.conf with appendonly yes/no).
Restoring via Docker Compose Terminal
If you prefer working inside the container, you can also copy the file directly into the Redis container using Docker commands.
Copy the Backup File into the Container
docker cp ./backup_2025_05_19.rdb $(docker-compose ps -q redis):/data/dump.rdbIf restoring an AOF file:
docker cp ./appendonly_2025_05_19.aof $(docker-compose ps -q redis):/data/appendonly.aofRestart Redis Inside Docker Compose
docker-compose restart redisRedis will detect the updated data file and load it during startup.
Partial Restores in Redis
Redis does not natively support partial restores like MySQL. However, you can achieve similar outcomes with the following strategies:
Restore Selected Keys via Redis CLI
If you exported individual key-value pairs using the redis-cli --rdb or similar logic, you can use a script to reinsert only those keys.
Example using redis-cli and a JSON/CSV conversion:
cat keys_to_restore.txt | while read key; do
  value=$(cat dump.json | jq -r ".\"$key\"")
  redis-cli SET "$key" "$value"
done
This approach assumes you have extracted individual key-value pairs into a format suitable for scripting.
Restore from A Partial AOF
If your append-only file includes only a subset of commands, Redis will replay those on startup. You can prepare a stripped-down AOF file for specific keys or operations, then follow the full AOF restore method described above.
Common Errors & How to Fix Them
Restoring Redis data can fail for a few specific reasons, especially related to permissions, missing config values, or service conflicts. Here are some frequent issues and how to solve them.
1. NOAUTH Authentication Required
(error) NOAUTH Authentication required.Cause: You’re attempting to issue commands or restore data into a Redis instance that requires authentication.
Resolution: Always provide the password with your commands:
redis-cli -a yourpasswordFor automated scripts, use:
redis-cli -a "$REDIS_PASSWORD" < restore_script.txt2. Redis Fails to Start After Restore
Fatal error loading the DB: Invalid RDB formatCause: Corrupted or incompatible dump.rdb or appendonly.aof file.
Resolution: Ensure the backup file matches the Redis version you’re using. Try restoring with a version of Redis that matches the backup environment.
3. Data Not Restored
Cause: Redis is configured to use AOF, but only an RDB file was restored or vice versa.
Resolution: Confirm your redis.conf or container command: entry defines which persistence method is enabled:
appendonly yes # For AOFappendonly no # For RDBMake sure the correct file (either dump.rdb or appendonly.aof) is in /data.
4. Permission Denied When Copying Files
cp: cannot create regular file ‘/opt/app/data/dump.rdb’: Permission deniedResolution: Ensure your terminal session or script has write access to the target directory. Use sudo if needed:
sudo cp ./backup.rdb /opt/app/data/dump.rdbIdentifying Slow Queries
Slow commands can impact Redis performance, especially under high load or when poorly optimized operations are used. Whether you’re using Redis on Elestio through the dashboard, accessing it inside a Docker Compose container, or connecting via CLI tools, Redis provides native tooling to monitor and troubleshoot performance issues. This guide explains how to capture slow operations using the Redis slow log, analyze command latency, and optimize performance through configuration and query changes.
Inspecting Slow Commands from the Terminal
Redis includes a built-in slowlog feature that tracks commands exceeding a configured execution time threshold. This is useful for identifying operations that may block the server or cause application latency.
Connect to your Redis instance via terminal
Use the Redis CLI to connect to your instance:
redis-cli -h <host> -p <port> -a <password>Replace <host>, <port>, and <password> with your Redis credentials from the Elestio dashboard.
View the slowlog threshold
Check the threshold that defines a “slow” command (in microseconds):
CONFIG GET slowlog-log-slower-thanThe default is 10000 (10 milliseconds). Any command exceeding this will be logged.
View the slow query log
To inspect recent slow commands:
SLOWLOG GET 10This shows the 10 most recent slow commands. Each entry includes the execution time, timestamp, and command details.
Analyzing Inside Docker Compose
If your Redis instance is deployed with Docker Compose, slow command inspection can be done inside the running container environment.
Access the Redis container
Open a shell inside the container:
docker-compose exec redis bashThen connect to Redis using:
redis-cli -a $REDIS_PASSWORDMake sure the REDIS_PASSWORD environment variable is defined in your Docker Compose file.
Check and adjust the slowlog threshold
You can view or change the slowlog threshold dynamically:
CONFIG SET slowlog-log-slower-than 10000Set a lower threshold (e.g., 5000) temporarily to capture more entries during testing.
Check how many entries are stored
The number of slowlog entries stored is configurable:
CONFIG GET slowlog-max-lenTo increase the history size:
CONFIG SET slowlog-max-len 256This allows storing more slow command logs for better visibility.
Using the Latency Monitoring Feature
Redis also includes latency monitoring tools that track spikes and identify root causes.
Enable latency monitoring
Latency tracking is often enabled by default. You can manually inspect events with:
LATENCY DOCTORThis command gives a report of latency spikes and their possible causes (e.g., slow commands, forks, or blocked I/O).
View latency history for specific events
To inspect latency for a specific category:
LATENCY HISTORY commandCommon tracked events include command, fork, aof-write, etc.
Understanding and Resolving Common Bottlenecks
Redis performance can degrade due to specific patterns of usage, large keys, blocking commands, or non-optimized pipelines.
Common causes of slow commands:
-
Large key operations: Commands like LRANGE, SMEMBERS, HGETALL on large datasets.
-
Blocking operations: Commands like BLPOP, BRPOP, or Lua scripts with long loops.
-
Forking overhead: Caused by background saves or AOF rewrites.
Best practices to avoid slow commands:
-
Use SCAN instead of KEYS for iteration.
-
Limit result sizes from large structures (e.g., use LRANGE 0 99 instead of full LRANGE).
-
Use pipelining to batch requests and reduce round trips.
-
Avoid multi-key operations when possible in a clustered setup.
Optimizing with Configuration Changes
Performance tuning can also involve modifying Redis settings related to memory, persistence, and networking.
Update these settings via redis.conf or dynamically with CONFIG SET:
CONFIG SET maxmemory-policy allkeys-lru
CONFIG SET save ""
Use caution with persistence settings. Disabling RDB or AOF improves performance but removes durability.
Detect and terminate long-running queries
Long-running commands in Redis can block the single-threaded event loop, causing delayed responses or complete unresponsiveness in production environments like Elestio. Monitoring and handling these commands is critical for maintaining performance and reliability. This guide explains how to detect, analyze, and terminate blocking or slow commands in Redis using terminal tools, Docker Compose setups, and Redis’s built-in logging features. It also includes prevention strategies to avoid performance bottlenecks in the future.
Monitoring Long-Running Commands
Redis does not support multitasking like traditional SQL databases, so any command that takes too long blocks the entire server. To inspect active commands and see which clients may be running long operations, use the Redis CLI.
Check active clients and their current commands
redis-cli -h <host> -p <port> -a <password> CLIENT LISTThis command shows all connected clients, including their IP address, command in progress (cmd), idle time, and total duration. Focus on clients with high idle or age values while still actively running commands.
Detect current command load using MONITOR
To observe commands in real time:
redis-cli -a <password> MONITORThis outputs every operation in real time. It’s useful for spotting blocking commands but should be used only in staging or during short troubleshooting sessions, as it consumes significant CPU.
Terminating Problematic Commands Safely
Redis provides tools to close problematic connections or interrupt Lua scripts that run for too long.
Kill a specific client connection
If a client is running a blocking or long operation, you can terminate its connection using its client ID:
CLIENT KILL ID <id>You can find the <id> from the CLIENT LIST command.
This will drop the connection and stop any running command associated with that client.
Stop a long-running Lua script
If a Lua script is stuck or taking too long:
SCRIPT KILLThis stops the currently executing script. If the script has modified data, Redis will return an error to avoid leaving the database in an inconsistent state.
If the script is not killable (e.g., during a write operation), Redis will return an error. Always use SCRIPT KILL cautiously.
Managing Inside Docker Compose
If your Redis service is running inside a Docker Compose setup on Elestio, you’ll need to access the container before you can inspect or kill commands.
Access the Redis container
docker-compose exec redis bashInside the container, connect to Redis using:
redis-cli -a $REDIS_PASSWORDThen, use CLIENT LIST, SCRIPT KILL, or CLIENT KILL just like from the host.
Using the Redis Slowlog Feature
Redis includes a built-in slowlog that logs commands that exceed a specific execution threshold.
Enable and configure slowlog in redis.conf
slowlog-log-slower-than 10000        # Log commands slower than 10ms
slowlog-max-len 128                  # Keep 128 slow entries
Update these settings in redis.conf, or set them at runtime:
CONFIG SET slowlog-log-slower-than 10000
CONFIG SET slowlog-max-len 128
View the slowlog
SLOWLOG GET 10This shows the 10 most recent slow commands with their timestamp, execution time, and command details.
Clear the slowlog
SLOWLOG RESETUse this to reset the log after reviewing or during maintenance.
Analyzing Command Latency Over Time
Redis includes latency tracking features to help you understand when and why delays occur.
Generate a diagnostic latency report
LATENCY DOCTORThis gives you a summary of observed latency spikes and their causes (e.g., command execution, AOF rewrite, background saves).
View detailed latency history by event
LATENCY HISTORY commandYou can replace command with any tracked event like fork, aof-write, or expire-cycle.
Best Practices to Prevent Long-Running Commands
Preventing long-running commands is critical since Redis handles all operations on a single thread.
-
Avoid full key scans: Never use KEYS * or SMEMBERS on large sets in production. Use SCAN instead for incremental iteration.
-
Limit Lua script duration: Break complex scripts into smaller steps and test for performance in staging.
-
Use pipelining: Send multiple commands in one round-trip to reduce overall time spent per operation.
-
Limit list and set access: Use ranges or batch operations for large data structures.
LRANGE mylist 0 99   # Good
LRANGE mylist 0 -1 # Risky on large lists-
Enable eviction policies: To avoid OOM errors that can freeze Redis, enable LRU or LFU eviction:
CONFIG SET maxmemory-policy allkeys-lru-
Monitor regularly: Use CLIENT LIST, SLOWLOG, and LATENCY in combination to detect problematic patterns early.
Preventing Full Disk Issues
Running out of disk space in a Redis environment can lead to failed writes, snapshot errors, and service unavailability. Redis relies on disk storage for persistence (RDB and AOF files), temporary dumps, and logs especially when persistence is enabled. On platforms like Elestio, while the infrastructure is managed, users are responsible for monitoring disk usage, configuring retention policies, and managing backups. This guide covers how to monitor disk consumption, configure alerts, remove unused data, and follow best practices to prevent full disk scenarios in a Redis setup using Docker Compose.
Monitoring Disk Usage
Disk usage monitoring is essential for spotting unusual growth before it leads to failures. In Docker Compose setups, you’ll need both host-level and container-level visibility.
Inspect the host system storage
Run this on the host machine to check which mount point is filling up:
df -hThis shows available and used space for each volume. Identify the mount point used by your Redis volume—usually mapped to something like /var/lib/docker/volumes/redis_data/_data.
Check disk usage from inside the container
Open a shell inside the Redis container:
docker-compose exec redis shInside the container, check the data directory size:
du -sh /dataThis reveals total usage by persistence files (appendonly.aof, dump.rdb, temporary files). You can inspect individual file sizes with:
ls -lh /dataConfiguring Alerts and Cleaning Up Storage
Monitoring alone isn’t enough—automated alerts and safe cleanup prevent downtime. You can inspect disk usage across Docker resources on the host with:
docker system dfIdentify unused Docker volumes
docker volume lsTo remove a specific unused volume:
docker volume rm <volume-name>Warning: Never delete the volume mapped to your Redis data unless you’ve backed up its contents and confirmed it is not in use.
Trigger AOF file compaction
If AOF persistence is enabled, the append-only file can grow large over time. You can manually trigger a rewrite to compact the file:
docker-compose exec redis redis-cli BGREWRITEAOFThis creates a smaller AOF file containing the same dataset.
Clean up old snapshots
If you are using RDB snapshots, they’re stored in /data within the container (mapped to a host volume). To clean up, list them first:
docker-compose exec redis ls -lh /dataRemove unnecessary .rdb files with:
docker-compose exec redis rm /data/dump-<timestamp>.rdbManaging & Optimizing Temporary Files
Redis creates temporary files during fork operations for AOF rewrites and RDB saves. These are stored in the container’s /tmp directory.
Monitor temporary file usage:
docker-compose exec redis du -sh /tmpIf /tmp fills up, writes and forks may fail. You can change the temporary directory by modifying the dir directive in redis.conf to point to /data, which is volume-backed:
dir /dataRestart the container to apply changes.
Best Practices for Disk Space Management
Long-term disk space health in Redis requires proactive design and ongoing management.
-
Avoid storing binary blobs: Store large files (images, PDFs, etc.) outside Redis and use Redis only for keys/metadata. Use object storage for large content.
-
Disable persistence if not needed: For ephemeral cache use cases, you can disable persistence entirely to reduce disk usage:
appendonly no
save ""-
Limit AOF growth: Fine-tune AOF rewrite behavior in redis.conf:
auto-aof-rewrite-percentage 100
auto-aof-rewrite-min-size 64mb-
Rotate logs in containers: If logging to file (e.g., /var/log/redis/redis-server.log), configure logrotate on the host or use Docker log rotation options via docker-compose.yml:
logging:
  driver: "json-file"
  options:
    max-size: "10m"
max-file: "3"-
Evict old keys with TTLs: Set expiration on cache keys to prevent unbounded growth:
SET session:<id> "data" EX 3600-
Monitor data size: Use INFO persistence and INFO memory to track memory usage and AOF file size:
docker-compose exec redis redis-cli INFO memory
docker-compose exec redis redis-cli INFO persistence-
Offload backups: Backups stored in /data should be moved off the container host. Use Elestio backup tools or mount a remote backup volume in your docker-compose.yml.
Checking Database Size and Related Issues
As your Redis data grows especially when using persistence modes like RDB or AOF it’s important to track how storage is being used. Unchecked growth can lead to full disks, failed writes, longer startup times, and backup complications. While Elestio handles the hosting, Redis storage tuning and cleanup remain your responsibility. This guide explains how to inspect keyspace size, analyze persistence files, detect unnecessary memory usage, and optimize Redis storage under a Docker Compose setup.
Checking Keyspace Usage and Persistence File Size
Redis doesn’t have schemas or tables, but its memory and disk footprint can be analyzed using built-in commands.
Check total memory used by Redis
From your terminal, connect to the container:
docker-compose exec redis redis-cli INFO memoryThis displays current memory stats. Look for the used_memory_human and maxmemory fields to understand real usage versus limits.
Inspect key count and usage by database
docker-compose exec redis redis-cli INFO keyspaceOutput looks like:
db0:keys=1250,expires=1200,avg_ttl=34560000This tells you how many keys exist, how many have TTLs set, and their average lifespan. If most keys never expire, your dataset may grow indefinitely.
View on-disk file sizes
Inside the Redis container, persistent files live under /data:
docker-compose exec redis sh -c "ls -lh /data"Check the sizes of:
-
dump.rdb (if RDB is enabled)
-
appendonly.aof (if AOF is enabled)
These files represent your on-disk dataset and can become large if not managed
Detecting Bloat and Unused Space
Redis may accumulate unnecessary memory usage due to expired keys not yet evicted, inefficient data structures, or infrequent AOF rewrites.
Estimate memory usage by key pattern
Redis doesn’t provide per-key memory stats natively, but you can sample keys and estimate memory usage:
docker-compose exec redis redis-cli --bigkeysThis scans a portion of the keyspace and reports the largest keys by type. If a single key is taking excessive space (e.g., a massive list or set), it may need to be split or purged.
Analyze memory per key (sample)
Use the MEMORY USAGE command to analyze specific keys:
docker-compose exec redis redis-cli MEMORY USAGE some:keyYou can script this to scan high-traffic prefixes and locate heavy keys.
Check fragmentation
Redis may fragment memory, reducing efficiency:
docker-compose exec redis redis-cli INFO memory | grep fragmentationA mem_fragmentation_ratio significantly above 1.2 suggests internal fragmentation.
Optimizing and Reclaiming Redis Storage
Once you’ve identified memory-heavy keys or large persistence files, Redis offers several tools to optimize space usage.
Trigger AOF rewrite (compacts the appendonly file)
If AOF is enabled, it grows over time. To reduce its size:
docker-compose exec redis redis-cli BGREWRITEAOFThis background process creates a smaller version of the AOF file without data loss.
Delete or expire unused keys
Manually delete stale keys or add TTLs to ensure automatic cleanup:
docker-compose exec redis redis-cli DEL obsolete:keyOr set expiration:
docker-compose exec redis redis-cli EXPIRE session:1234 3600Use patterns to delete multiple keys (carefully!):
docker-compose exec redis redis-cli --scan --pattern "temp:*" | xargs -n 100 redis-cli DELAvoid FLUSHALL or bulk deletes in production unless absolutely necessary.
Tune maxmemory and eviction policy
To enforce automatic eviction when nearing memory limits, In redis.conf (mounted via Docker volume):
maxmemory 512mb
maxmemory-policy allkeys-lru
Restart the container to apply changes. This keeps Redis performant under constrained storage.
Managing and Optimizing Redis Files on Disk
Monitor data directory inside Docker
Redis typically writes to /data in the container (mapped from a host volume). Check usage from the host:
docker system dfList all Docker volumes:
docker volume lsCheck Redis volume size (replace <volume_name>):
sudo du -sh /var/lib/docker/volumes/<volume_name>/_dataClean up RDB snapshots and old backups
RDB snapshots (e.g. dump.rdb) are stored in /data. Clean up old or unneeded ones manually:
docker-compose exec redis rm /data/dump-<timestamp>.rdbEnsure backups are offloaded to external storage and not stored alongside the live database.
Best Practices for Redis Storage Management
-
Use TTLs liberally: Set expiration on all temporary/session keys to prevent unbounded growth.
-
Avoid storing large binary blobs: Store images, files, or videos outside Redis. Use Redis for metadata only.
-
Rotate logs: If Redis logs to file (e.g., /var/log/redis.log), rotate them via Docker logging options or tools like logrotate.
In docker-compose.yml
logging:
  driver: "json-file"
  options:
    max-size: "10m"
max-file: "3"-
Use efficient data structures: Prefer HASH or SET over storing large JSON blobs as strings.
-
Monitor AOF size and compaction frequency: If AOF is growing too fast, adjust these in redis.conf:
auto-aof-rewrite-percentage 100
auto-aof-rewrite-min-size 64mb-
Archive analytics data: For time-series or metrics data, periodically move old entries to cold storage.
-
Back up to offsite storage: Avoid keeping snapshots on the same disk or volume. Use Elestio’s backup integrations to store them in cloud or remote storage.
Database Migration
Cloning a Service to Another Provider or Region
Migrating or cloning services across cloud providers or geographic regions is a critical part of modern infrastructure management. Whether you’re optimizing for latency, preparing for disaster recovery, meeting regulatory requirements, or simply switching providers, a well-planned migration ensures continuity, performance, and data integrity. This guide outlines a structured methodology for service migration, applicable to most cloud-native environments.
Pre-Migration Preparation
Before initiating a migration, thorough planning and preparation are essential. This helps avoid unplanned downtime, data loss, or misconfiguration during the move:
- Evaluate the Current Setup: Begin by documenting the existing service’s configuration. This includes runtime environments (container images, platform versions), persistent data (databases, object storage), network rules (ports, firewalls), and application dependencies (APIs, credentials, linked services).
- Define the Migration Target: Choose the new cloud provider or region you plan to migrate to. Confirm service compatibility, resource limits, and geographic latency requirements. If you’re replicating an existing environment, make sure the target region supports the same compute/storage features and versions.
- Provision the Target Environment: Set up the target infrastructure where the service will be cloned. This could involve creating new Kubernetes clusters, VM groups, container registries, databases, or file storage volumes depending on your stack.
- Backup the Current Service: Always create a full backup or snapshot of the current service and its associated data before proceeding. This acts as a rollback point in case of migration issues and ensures recovery in the event of failure.
Cloning Execution
The first step in executing a clone is to replicate the configuration of the original service in the target environment. This involves deploying the same container image or service binary using the same runtime settings. If you’re using Kubernetes or container orchestrators, this can be done via Helm charts or declarative manifests. Pay close attention to environment variables, secrets, mounted paths, storage class definitions, and health check configurations to ensure a consistent runtime environment.
Next, you’ll need to migrate any persistent data tied to the service. For file-based storage, tools like rsync or rclone are effective for copying volume contents over SSH or cloud storage backends. It’s crucial to verify compatibility across disk formats, database versions, and encoding standards to avoid corruption or mismatched behavior.
After replicating the environment and data, it’s important to validate the new service in isolation. This means confirming that all application endpoints respond as expected, background tasks or cron jobs are functioning, and third-party integrations (e.g., payment gateways, S3 buckets) are accessible. You should test authentication flows, data read/write operations, and retry logic to ensure the new service is functionally identical. Use observability tools to monitor resource consumption and application logs during this stage.
Once validation is complete, configure DNS and route traffic to the new environment. This might involve updating DNS A or CNAME records, changing cloud load balancer configurations, or applying new firewall rules. For high-availability setups, consider using health-based routing or weighted DNS to gradually transition traffic from the old instance to the new one.
Post-Migration Validation and Optimization
Once the new environment is live and receiving traffic, focus on optimizing and securing the setup:
- Validate Application Functionality: Test all integrations, user workflows, and background jobs to confirm proper behavior. Review logs for silent errors or timeouts. Ensure all applications pointing to the service are updated with the new URL or connection string.
- Monitor Performance: Analyze load, CPU, memory, and storage utilization. Scale resources as needed, or optimize runtime settings for the new provider/region. Enable autoscaling where applicable.
- Secure the Environment: Implement firewall rules, IP restrictions, and access controls. Rotate secrets and validate that no hardcoded credentials or endpoints point to the old service.
- Cleanup and Documentation: Once validated, decommission the old setup safely. Update internal documentation with new deployment details, endpoint addresses, and any configuration changes.
Benefits of Cloning
Cloning a database service, particularly for engines like Redis offers several operational and strategic advantages. It allows teams to test schema migrations, version upgrades, or major application features in an isolated environment without affecting production. By maintaining a cloned copy, developers and QA teams can work against realistic data without introducing risk.
Cloning also simplifies cross-region redundancy setups. A replica in another region can be promoted quickly if the primary region experiences an outage. For compliance or analytics purposes, cloned databases allow for read-only access to production datasets, enabling safe reporting or data processing without interrupting live traffic.
Additionally, rather than building a new environment from scratch, you can clone the database into another provider, validate it, and cut over with minimal disruption. This helps maintain operational continuity and reduces the effort needed for complex migrations.
Database Migration Services for Redis
Elestio provides a streamlined and reliable approach for migrating Redis instances from various environments such as on-premises servers, self-managed cloud deployments, or other managed services into its fully managed Redis platform. This migration process is designed to ensure data consistency, minimize downtime, and simplify the operational complexity of managing Redis infrastructure.
Key Steps in Migrating to Elestio
Pre-Migration Preparation
Before initiating your Redis migration, proper preparation is essential to ensure a seamless and error-free transition:
- Create an Elestio Account: Sign up on the Elestio platform to access its suite of managed services. This account will serve as the central hub for provisioning and managing your Redis instance.
- Deploy the Target Redis Service: Create a new Redis service on Elestio to act as the migration destination. Make sure the version matches your current Redis setup to avoid compatibility issues. Review Elestio’s Redis documentation for details on supported features, such as persistence modes (AOF, RDB), module support, and cluster configurations.
Initiating the Migration Process
With the target environment ready, proceed with the Redis migration using the Elestio migration interface:
- Access the Migration Tool: Navigate to your Redis service overview on the Elestio dashboard. Select the “Migrate Database” option to initiate the guided migration workflow.
- Configure Migration Settings: A prompt will appear to confirm that the target Redis instance has sufficient memory and disk capacity to receive the source data. Once verified, click “Get started” to begin.
- Validate Source Redis Connection: Enter the connection details for your existing Redis instance, including:
-
Hostname – IP address or domain of the source Redis server
-
Port – Default Redis port is 6379, but on Elestio it is configured as 26379
-
Password – If your Redis instance is secured with authentication
-
Database Number – (Optional) If using a specific logical database within Redis
-
Click “Run Check” to validate the source connection. This ensures Elestio can securely access and read from your Redis instance. These details are typically available in your current Redis deployment configuration or environment variables.
4. Execute the Migration: If all checks pass successfully, start the migration by selecting “Start migration.” Elestio will begin transferring the in-memory dataset and persistent data (if applicable) into the new environment. Real-time logs and progress indicators will help you monitor the operation, making it easy to identify and resolve any issues promptly.
Post-Migration Validation and Optimization
Once the Redis migration is complete, it’s critical to validate the deployment and ensure the new instance performs optimally:
- Verify Data Consistency: Use redis-cli or Elestio’s integrated tools to confirm that all keys, data types, and values were correctly transferred. Compare key counts and sample data between source and target. If using persistence (RDB or AOF), check the loading behavior on restart to ensure durability.
- Test Application Connectivity: Update application configurations or connection strings to point to the new Redis instance. Verify that all interactions such as caching, pub/sub, or session storage are functioning as expected.
- Optimize Performance: Take advantage of Elestio’s performance features. Monitor memory usage, eviction policies, and throughput in real-time using the platform’s dashboard. Adjust Redis configurations for your workload type and enable auto-scaling if supported.
- Implement Security Best Practices: Secure your new Redis instance by configuring firewall rules, enabling TLS (if applicable), and rotating authentication credentials. Elestio supports access management features that help restrict unauthorized connections and secure data in transit.
- Clean Up and Document: After successful validation, decommission the old Redis environment if no longer needed. Update your internal documentation to reflect the new Redis endpoint, authentication details, and any configuration changes made during migration.
Benefits of Using Elestio for Redis
Migrating Redis to Elestio delivers several operational and strategic benefits:
- Simplified Management: Elestio automates the operational overhead of managing Redis, including monitoring, backups, and software updates. The centralized dashboard provides real-time visibility into performance, key metrics, and system health. Users can modify environment variables, upgrade service tiers, and manage Redis modules without deep DevOps intervention.
- Security: Elestio keeps Redis instances up to date with the latest security patches. It offers built-in mechanisms for securely managing credentials and limits unauthorized access through firewall rules and network isolation. Backup automation ensures data is safe and recoverable.
- Performance: Redis instances on Elestio are tuned for low-latency performance and can handle real-time, high-throughput workloads. The infrastructure supports both standalone and clustered Redis deployments, allowing for optimal performance under load.
- Scalability: Elestio’s Redis services are built to scale with your application. Users can increase memory capacity, CPU allocation, or attach additional storage as demand grows. The platform supports seamless plan upgrades without significant downtime, enabling consistent growth and workload flexibility.
Manual Redis Migration Using redis-cli and RDB Files
Manual migrations using Redis’s built-in tools, such as redis-cli and RDB (Redis Database) files, are ideal for users who require full control over data export and import particularly during transitions between providers, Redis version upgrades, or importing existing self-managed Redis datasets into Elestio’s managed environment. This guide walks through the process of performing a manual migration to and from Elestio Redis services using command-line tools, ensuring data portability, consistency, and transparency at every step.
When to Use Manual Migration
Manual migration using native Redis tools is well-suited for scenarios that demand complete control over the migration process. It is especially useful when transferring data from a self-hosted Redis instance, an on-premises server, or another cloud provider into Elestio’s managed Redis service. This method supports one-time imports without requiring persistent connections between source and destination systems.
It also provides a reliable approach for performing version upgrades. Because RDB files contain a snapshot of the dataset in a portable format, they can be restored into newer Redis versions with minimal compatibility issues. When Elestio’s built-in tools are not applicable such as in migrations from isolated environments or selective key transfers manual migration becomes the preferred option. It also enables offline backup archiving, providing users with transportable and restorable datasets independent of platform-specific formats.
Performing the Migration
Prepare the Environments
Before starting the migration, ensure that Redis is properly installed on both the source system and your Elestio service. The source Redis server must allow access (if remote) and have a user with sufficient privileges to export the dataset, including read access to all relevant keys and data types.
On the Elestio side, provision a Redis service through the dashboard. Once it’s active, retrieve the connection credentials from the Database Info section. This includes host, port, and password. Verify that your public IP is allowed under Cluster Overview > Security > Limit access per IP, or the Redis port will not be reachable.
Create a Backup Using RDB
Use Redis’s RDB snapshotting method to create a backup of the dataset. This process serializes the current state of your Redis database into a binary .rdb file.
To trigger a manual snapshot, run:
redis-cli -h <source_host> -p <source_port> SAVEOnce the command completes, locate the resulting dump.rdb file on the source system. This is typically stored in /var/lib/redis/ or a path defined in your Redis configuration.
Alternatively, you can generate an RDB file using:
redis-cli --rdb backup.rdbThis creates a portable snapshot of the entire dataset without modifying the source instance’s configuration.
Transfer the Dump File to the Target
If your local system differs from the one with access to Elestio’s Redis service, transfer the dump file using a secure file transfer tool such as SCP:
scp backup.rdb user@host:/path/to/restore-system/Ensure the file is available on the system you will use to perform the restore. You do not need to upload the RDB file directly to the Elestio service restores are performed remotely using Redis commands.
Restore the Dataset to Elestio
To restore data into Elestio, start a temporary local Redis instance using the dump file:
redis-server --dbfilename dump.rdb --dir /path/to/rdb/This allows you to access the original dataset locally. Then, connect to both the local and Elestio Redis instances and copy keys using redis-cli. For example:
redis-cli -h <source_host> --scan | while read key; do
  redis-cli -h <source_host> DUMP "$key" | \
  redis-cli -h <elestio_host> -p <elestio_port> -a <elestio_password> RESTORE "$key" 0 -
done
This approach reads each key from the source instance and restores it to the Elestio-managed Redis instance. Ensure that both instances are reachable and that no firewall or access rules block communication.
For large datasets or environments with complex key structures, consider using community tools like redis-copy or redis-migrate-tool to streamline key transfers.
Validate the Migration
After completing the import, verify that the migration was successful by connecting to the Elestio Redis instance and inspecting the dataset.
Start by checking the total key count:
redis-cli -h <elestio_host> -p <elestio_port> -a <elestio_password> DBSIZEReview specific keys to confirm data consistency:
redis-cli -h <elestio_host> -p <elestio_port> -a <elestio_password> KEYS *Also verify the integrity of sets, hashes, lists, and sorted sets if used in your application. Ensure that your application connects to the new Redis instance without issues and performs expected operations.
If you’ve updated environment variables or configuration files, confirm that your changes are reflected in the application deployment.
Benefits of Manual Migration
Manual Redis migration using redis-cli and RDB files offers several important advantages:
- Portability and Compatibility: RDB files are standard Redis snapshot formats that can be restored into any Redis-compatible instance, whether hosted locally, in containers, or in the cloud.
- Version Flexibility: Migrate across Redis versions using forward-compatible RDB snapshots, without relying on binary compatibility or replication.
- Offline Storage: Backup files can be stored offline, versioned, and archived as part of disaster recovery or compliance processes.
- Platform Independence: Elestio does not enforce proprietary formats. Native Redis tools give you complete control over export, transfer, and restoration operations.
Cluster Management
Overview
Elestio provides a complete solution for setting up and managing software clusters. This helps users deploy, scale, and maintain applications more reliably. Clustering improves performance and ensures that services remain available, even if one part of the system fails. Elestio supports different cluster setups to handle various technical needs like load balancing, failover, and data replication.
Supported Software for Clustering:
Elestio supports clustering for a wide range of open-source software. Each is designed to support different use cases like databases, caching, and analytics:
-
MySQL:
Supports Single Node, Primary/Replica, and Multi-Master cluster types. These allow users to create simple setups or more advanced ones where reads and writes are distributed across nodes. In a Primary/Replica setup, replicas are updated continuously through replication. These configurations are useful for high-traffic applications that need fast and reliable access to data. -
PostgreSQL:
PostgreSQL clusters can be configured for read scalability and failover protection. Replication ensures that data written to the primary node is copied to replicas. Clustering PostgreSQL also improves query throughput by offloading read queries to replicas. Elestio handles replication setup and node failover automatically. -
Redis/KeyDB/Valkey:
These in-memory data stores support clustering to improve speed and fault tolerance. Clustering divides data across multiple nodes (sharding), allowing horizontal scaling. These tools are commonly used for caching and real-time applications, so fast failover and data availability are critical. -
Hydra and TimescaleDB:
These support distributed and time-series workloads, respectively. Clustering helps manage large datasets spread across many nodes. TimescaleDB, built on PostgreSQL, benefits from clustering by distributing time-based data for fast querying. Hydra uses clustering to process identity and access management workloads more efficiently in high-load environments.
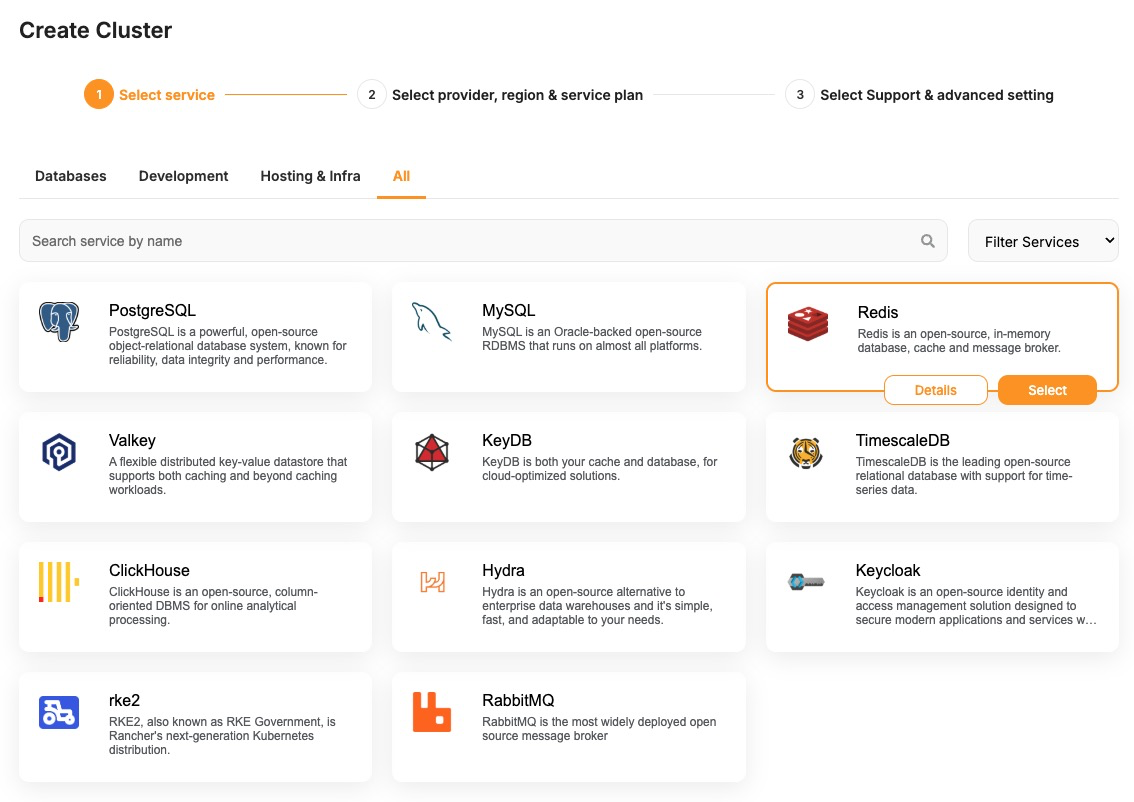
Note: Elestio is frequently adding support for more clustered software like OpenSearch, Kafka, and ClickHouse. Always check the Elestio catalogue for the latest supported services.
Cluster Configurations:
Elestio offers several clustering modes, each designed for a different balance between simplicity, speed, and reliability:
- Single Node:
This setup has only one node and is easy to manage. It acts as a standalone Primary node. It’s good for testing, development, or low-traffic applications. Later, you can scale to more nodes without rebuilding the entire setup. Elestio lets you expand this node into a full cluster with just a few clicks. - Primary/Replica:
One node (Primary) handles all write operations, and one or more Replicas handle read queries. Replication is usually asynchronous and ensures data is copied to all replicas. This improves read performance and provides redundancy if the primary node fails. Elestio manages automatic data syncing and failover setup.
Cluster Management Features:
Elestio’s cluster dashboard includes tools for managing, monitoring, and securing your clusters. These help ensure stability and ease of use:
-
Node Management:
You can scale your cluster by adding or removing nodes as your app grows. Adding a node increases capacity; removing one helps reduce costs. Elestio handles provisioning and configuring nodes automatically, including replication setup. This makes it easier to scale horizontally without downtime. -
Backups and Restores:
Elestio provides scheduled and on-demand backups for all nodes. Backups are stored securely and can be restored if something goes wrong. You can also create a snapshot before major changes to your system. This helps protect against data loss due to failures, bugs, or human error. -
Access Control:
You can limit access to your cluster using IP allowlists, ensuring only trusted sources can connect. Role-based access control (RBAC) can be applied for managing different user permissions. SSH and database passwords are generated securely and can be rotated easily from the dashboard. These access tools help reduce the risk of unauthorized access. -
Monitoring and Alerts:
Real-time metrics like CPU, memory, disk usage, and network traffic are available through the dashboard. You can also check logs for troubleshooting and set alerts for high resource usage or failure events. Elestio uses built-in observability tools to monitor the health of your cluster and notify you if something needs attention. This allows you to catch problems early and take action.
Deploying a New Cluster
Creating a cluster is a foundational step when deploying services in Elestio. Clusters provide isolated environments where you can run containerized workloads, databases, and applications. Elestio’s web dashboard helps the process, allowing you to configure compute resources, choose cloud providers, and define deployment regions without writing infrastructure code. This guide walks through the steps required to create a new cluster using the Elestio dashboard.
Prerequisites
To get started, you’ll need an active Elestio account. If you’re planning to use your own infrastructure, make sure you have valid credentials for your preferred cloud provider (like AWS, GCP, Azure, etc.). Alternatively, you can choose to deploy clusters using Elestio-managed infrastructure, which requires no external configuration.
Creating a Cluster
Once you’re logged into the Elestio dashboard, navigate to the Clusters section from the sidebar. You’ll see an option to Create a new cluster—clicking this will start the configuration process. The cluster creation flow is flexible but simple for defining essential details like provider, region, and resources in one place.
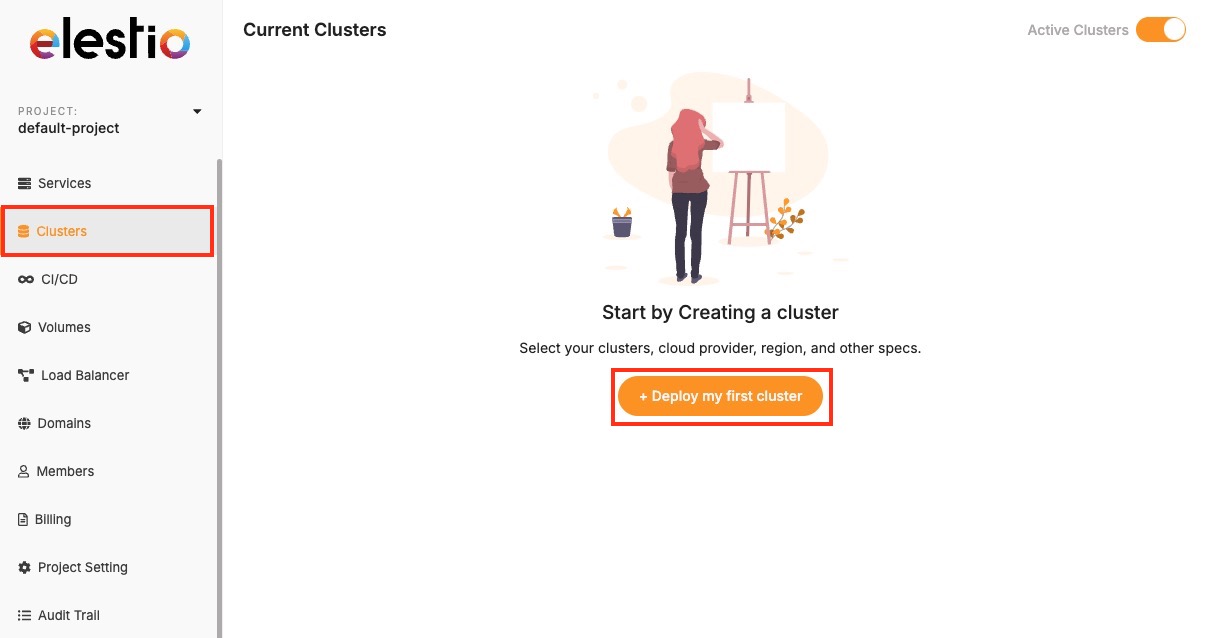
Now, select the database service of your choice that you need to create in a cluster environment. Click on Select button as you choose one.
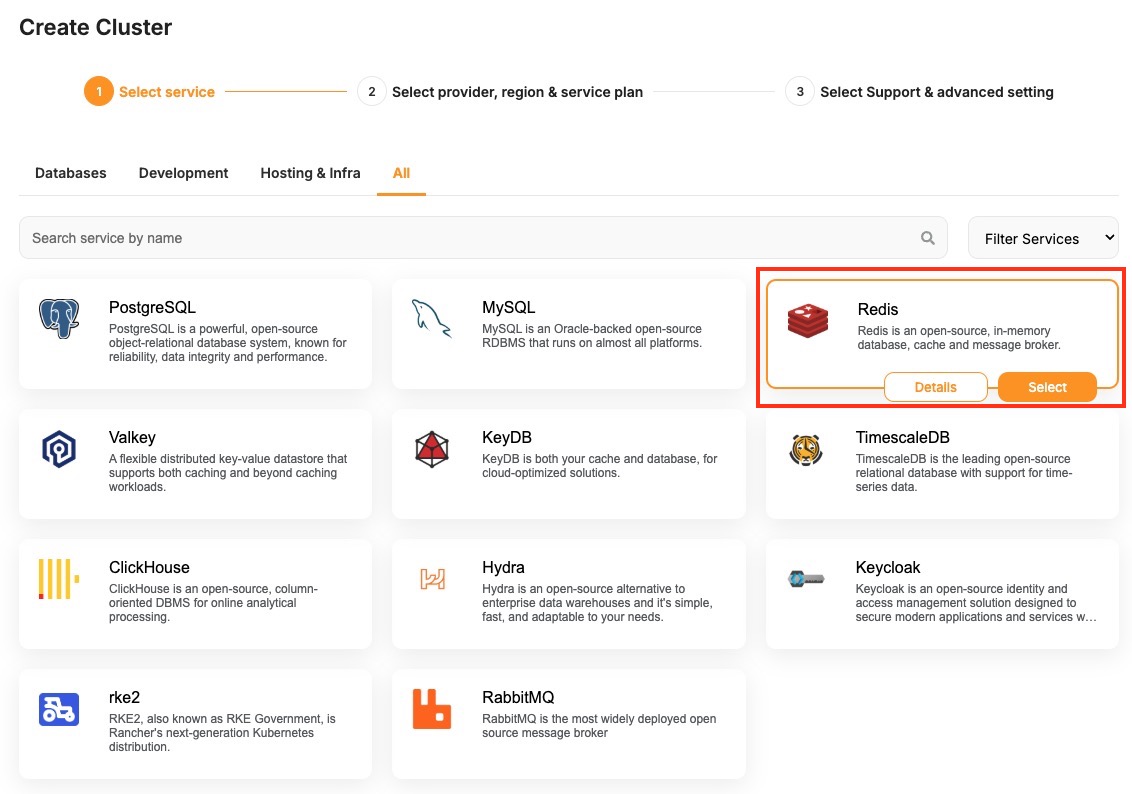
During setup, you’ll be asked to choose a hosting provider. Elestio supports both managed and BYOC (Bring Your Own Cloud) deployments, including AWS, DigitalOcean, Hetzner, and custom configurations. You can then select a region based on latency or compliance needs, and specify the number of nodes along with CPU, RAM, and disk sizes per node.
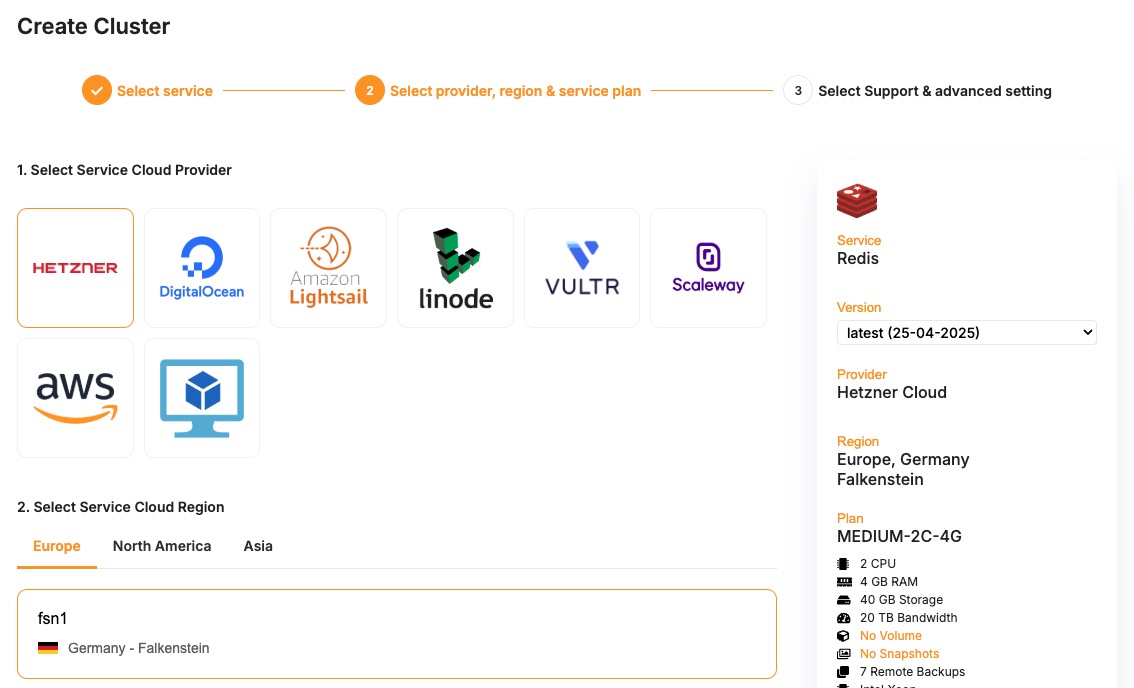
If you’re setting up a high-availability cluster, the dashboard also allows you to configure cluster-related details under Cluster configuration, where you get to select things like replication modes, number of replicas, etc. After you’ve configured the cluster, review the summary to ensure all settings are correct. Click the Create Cluster button to begin provisioning.
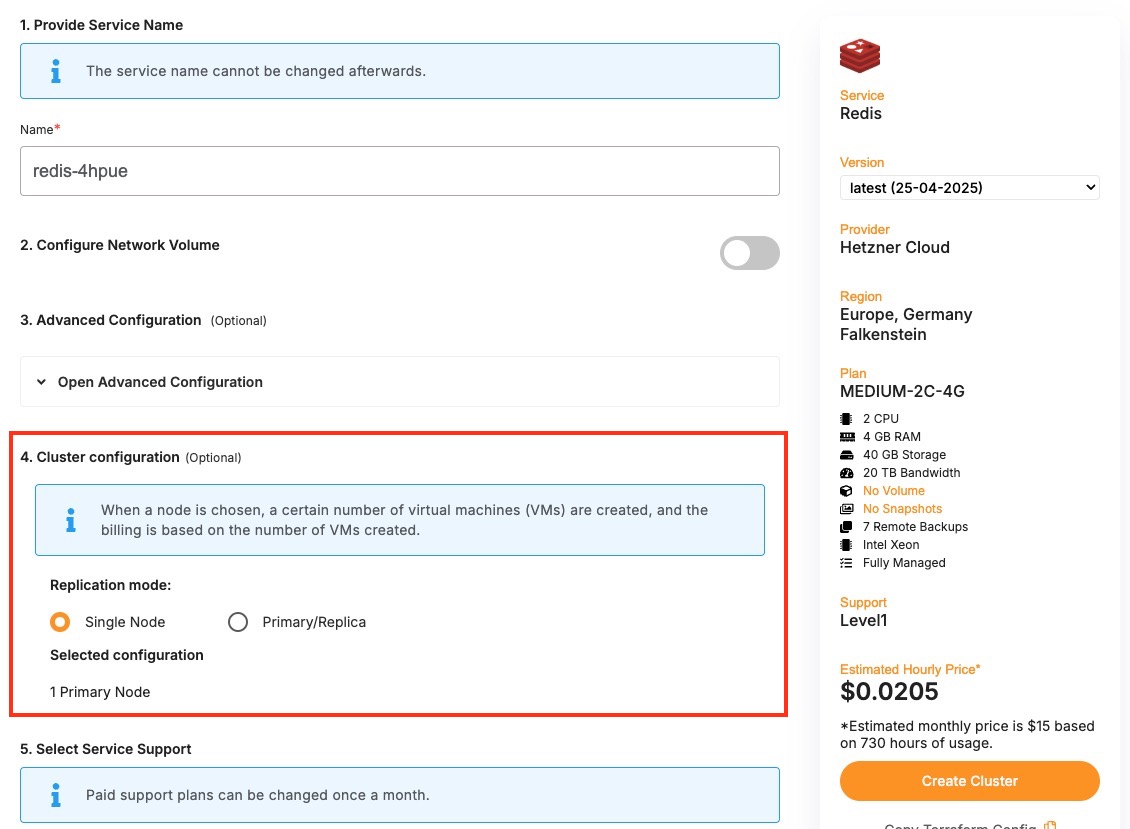
Elestio will start the deployment process, and within a few minutes, the cluster will appear in your dashboard. Once your cluster is live, it can be used to deploy new nodes and additional configurations. Each cluster supports real-time monitoring, log access, and scaling operations through the dashboard. You can also set up automated backups and access control through built-in features available in the cluster settings.
Node Management
Node management plays a critical role in operating reliable and scalable infrastructure on Elestio. Whether you’re deploying stateless applications or stateful services like databases, managing the underlying compute units nodes is essential for maintaining stability and performance.
Understanding Nodes
In Elestio, a node is a virtual machine that contributes compute, memory, and storage resources to a cluster. Clusters can be composed of a single node or span multiple nodes, depending on workload demands and availability requirements. Each node runs essential services and containers as defined by your deployed applications or databases.
Nodes in Elestio are provider-agnostic, meaning the same concepts apply whether you’re using Elestio-managed infrastructure or connecting your own cloud provider (AWS, Azure, GCP, etc.). Each node is isolated at the VM level but participates fully in the cluster’s orchestration and networking. This abstraction allows you to manage infrastructure without diving into the complexity of underlying platforms.
Node Operations
The Elestio dashboard allows you to manage the lifecycle of nodes through clearly defined operations. These include:
-
Creating a node, which adds capacity to your cluster and helps with horizontal scaling of services. This is commonly used when load increases or when preparing a high-availability deployment.
-
Deleting a node, which removes underutilized or problematic nodes. Safe deletion includes draining workloads to ensure service continuity.
-
Promoting a node, which changes the role of a node within the cluster—typically used in clusters with redundancy, where certain nodes may need to take on primary or leader responsibilities.
Each of these operations is designed to be safely executed through the dashboard and is validated against the current cluster state to avoid unintended service disruption. These actions are supported by Elestio’s backend orchestration, which handles tasks like container rescheduling and load balancing when topology changes.
Monitoring and Maintenance
Monitoring is a key part of effective node management. Elestio provides per-node visibility through the dashboard, allowing you to inspect CPU, memory, and disk utilization in real time. Each node also exposes logs, status indicators, and health checks to help detect anomalies or degradation early.
In addition to passive monitoring, the dashboard supports active maintenance tasks. You can reboot a node when applying system-level changes or troubleshooting, or drain a node to safely migrate workloads away from it before performing disruptive actions. Draining ensures that running containers are rescheduled on other nodes in the cluster, minimizing service impact.
For production setups, combining resource monitoring with automation like scheduled reboots, log collection, and alerting can help catch issues before they affect users. While Elestio handles many aspects of orchestration automatically, having visibility at the node level helps teams make informed decisions about scaling, updates, and incident response.
Cluster-wide resource graphs and node-level metrics are also useful for capacity planning. Identifying trends such as memory saturation or disk pressure allows you to preemptively scale or rebalance workloads, reducing the risk of downtime.
Adding a Node
As your application usage grows or your infrastructure requirements change, scaling your cluster becomes essential. In Elestio, you can scale horizontally by adding new nodes to an existing cluster. This operation allows you to expand your compute capacity, improve availability, and distribute workloads more effectively.
Need to Add a Node
There are several scenarios where adding a node becomes necessary. One of the most common cases is resource saturation when existing nodes are fully utilized in terms of CPU, memory, or disk. Adding another node helps distribute the workload and maintain performance under load.
In clusters that run stateful services or require high availability, having additional nodes ensures that workloads can fail over without downtime. Even in development environments, nodes can be added to isolate environments or test services under production-like load conditions. Scaling out also gives you flexibility when deploying services with different resource profiles or placement requirements.
Add a Node to Cluster
To begin, log in to the Elestio dashboard and navigate to the Clusters section from the sidebar. Select the cluster you want to scale. Once inside the cluster view, switch to the Nodes tab. This section provides an overview of all current nodes along with their health status and real-time resource usage.
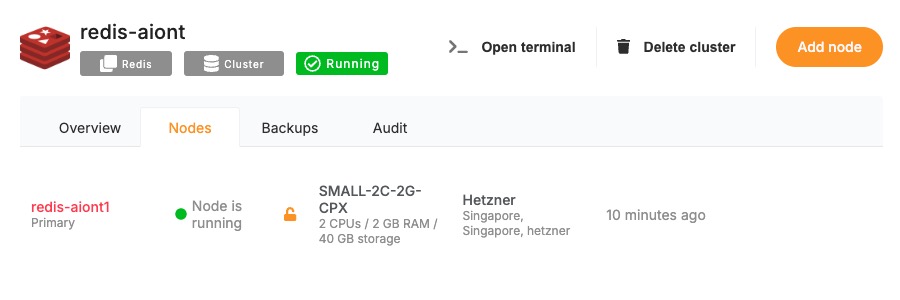
To add a new node, click the “Add Node” button. This opens a configuration panel where you can define the specifications for the new node. You’ll be asked to specify the amount of CPU, memory, and disk you want to allocate. If you’re using a bring-your-own-cloud setup, you may also need to confirm or choose the cloud provider and deployment region.
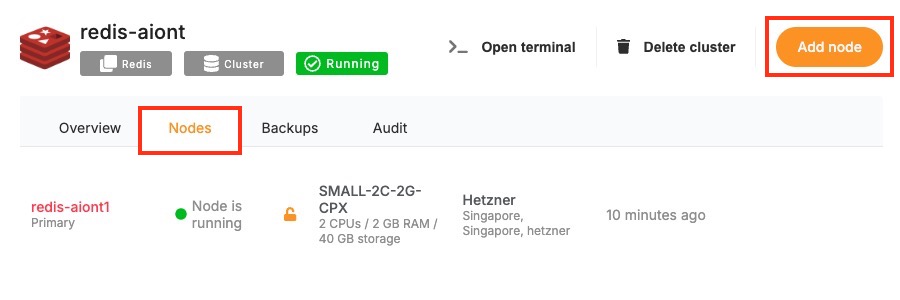
After configuring the node, review the settings to ensure they meet your performance and cost requirements. Click “Create” to initiate provisioning. Elestio will begin setting up the new node, and once it’s ready, it will automatically join your cluster.
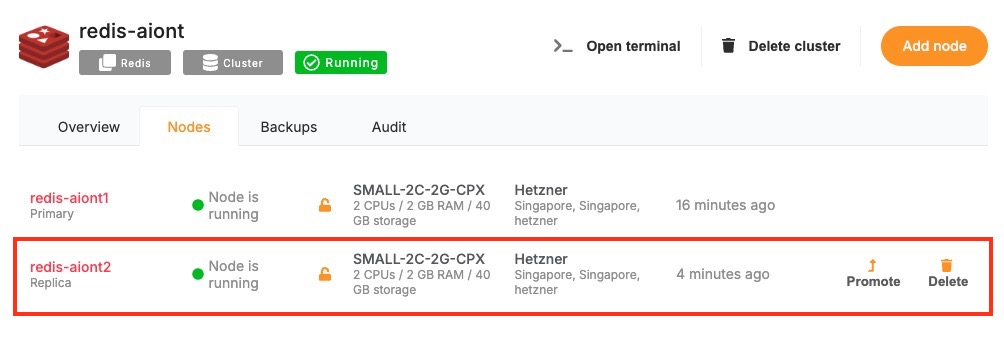
Once provisioned, the new node will appear in the node list with its own metrics and status indicators. You can monitor its activity, verify that workloads are being scheduled to it, and access its logs directly from the dashboard. From this point onward, the node behaves like any other in the cluster and can be managed using the same lifecycle actions such as rebooting or draining.
Post-Provisioning Considerations
After the node has been added, it becomes part of the active cluster and is available for scheduling workloads. Elestio’s orchestration layer will begin using it automatically, but you can further customize service placement through resource constraints or affinity rules if needed.
For performance monitoring, the dashboard provides per-node metrics, including CPU load, memory usage, and disk I/O. This visibility helps you confirm that the new node is functioning correctly and contributing to workload distribution as expected.
Maintenance actions such as draining or rebooting the node are also available from the same interface, making it easy to manage the node lifecycle after provisioning.
Promoting a Node
Clusters can be designed for high availability or role-based workloads, where certain nodes may take on leadership or coordination responsibilities. In these scenarios, promoting a node is a key administrative task. It allows you to change the role of a node. While not always needed in basic setups, node promotion becomes essential in distributed systems, replicated databases, or services requiring failover control.
When to Promote a Node?
Promoting a node is typically performed in clusters where role-based architecture is used. In high-availability setups, some nodes may act as leaders while others serve as followers or replicas. If a leader node becomes unavailable or needs to be replaced, you can promote another node to take over its responsibilities and maintain continuity of service.
Node promotion is also useful when scaling out and rebalancing responsibilities across a larger cluster. For example, promoting a node to handle scheduling, state tracking, or replication leadership can reduce bottlenecks and improve responsiveness. In cases involving database clusters or consensus-driven systems, promotion ensures a clear and controlled transition of leadership without relying solely on automatic failover mechanisms.
Promote a Node in Elestio
To promote a node, start by accessing the Clusters section in the Elestio dashboard. Choose the cluster containing the node you want to promote. Inside the cluster view, navigate to the Nodes tab to see the full list of nodes, including their current roles, health status, and resource usage. Locate the node that you want to promote and open its action menu. From here, select the “Promote Node” option.
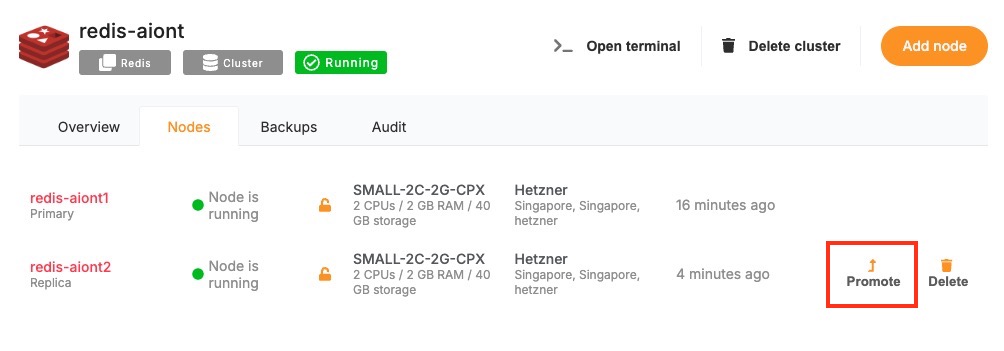
You may be prompted to confirm the action, depending on the configuration and current role of the node. This confirmation helps prevent unintended role changes that could affect cluster behavior.
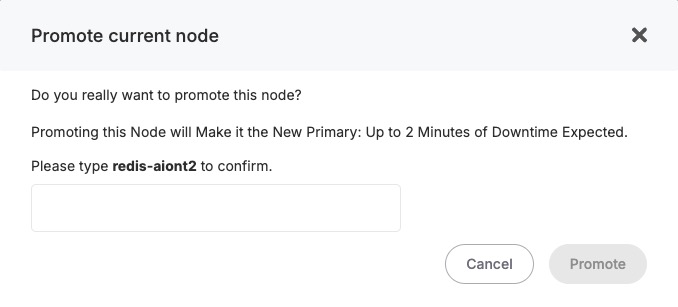
Once confirmed, Elestio will initiate the promotion process. This involves reconfiguring the cluster’s internal coordination state to acknowledge the new role of the promoted node. Depending on the service architecture and the software running on the cluster, this may involve reassigning leadership, updating replication targets, or shifting service orchestration responsibilities.
After promotion is complete, the node’s updated role will be reflected in the dashboard. At this point, it will begin operating with the responsibilities assigned to its new status. You can monitor its activity, inspect logs, and validate that workloads are being handled as expected.
Considerations for Promotion
Before promoting a node, ensure that it meets the necessary resource requirements and is in a stable, healthy state. Promoting a node that is under high load or experiencing performance issues can lead to service degradation. It’s also important to consider replication and data synchronization, especially in clusters where stateful components like databases are in use.
Promotion is a safe and reversible operation, but it should be done with awareness of your workload architecture. If your system relies on specific leader election mechanisms, promoting a node should follow the design patterns supported by those systems.
Removing a Node
Over time, infrastructure needs change. You may scale down a cluster after peak load, decommission outdated resources, or remove a node that is no longer needed for cost, isolation, or maintenance reasons. Removing a node from a cluster is a safe and structured process designed to avoid disruption. The dashboard provides an accessible interface for performing this task while preserving workload stability.
Why Remove a Node?
Node removal is typically part of resource optimization or cluster reconfiguration. You might remove a node when reducing costs in a staging environment, when redistributing workloads across fewer or more efficient machines, or when phasing out a node for maintenance or retirement.
Another common scenario is infrastructure rebalancing, where workloads are shifted to newer nodes with better specs or different regions. Removing an idle or underutilized node can simplify management and reduce noise in your monitoring stack. It also improves scheduling efficiency by removing unneeded targets from the orchestration engine.
In high-availability clusters, node removal may be preceded by data migration or role reassignment (such as promoting a replica). Proper planning helps maintain system health while reducing reliance on unnecessary compute resources.
Remove a Node
To begin the removal process, open the Elestio dashboard and navigate to the Clusters section. Select the cluster that contains the node you want to remove. From within the cluster view, open the Nodes tab to access the list of active nodes and their statuses.
Find the node you want to delete from the list. If the node is currently running services, ensure that those workloads can be safely rescheduled to other nodes or are no longer needed. Since Elestio does not have a built-in drain option, any workload redistribution needs to be handled manually, either by adjusting deployments or verifying that redundant nodes are available. Once the node is drained and idle, open the action menu for that node and select “Delete Node”.
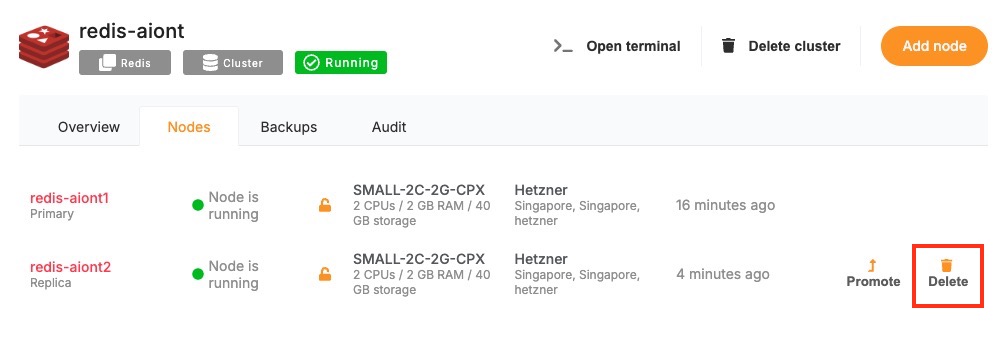
The dashboard may prompt you to confirm the operation. After confirmation, Elestio will begin the decommissioning process. This includes detaching the node from the cluster, cleaning up any residual state, and terminating the associated virtual machine.
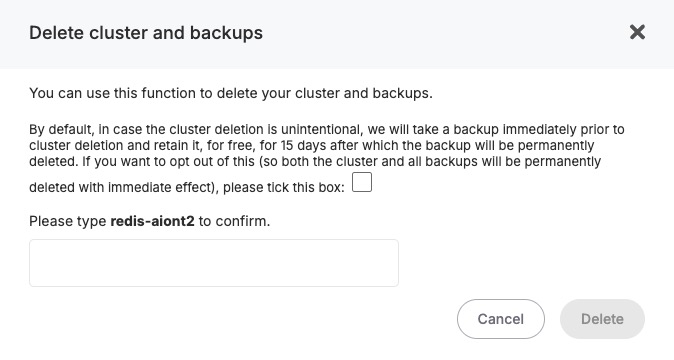
Once the operation completes, the node will no longer appear in the cluster’s node list, and its resources will be released.
Considerations for Safe Node Removal
Before removing a node in Elestio, it’s important to review the services and workloads currently running on that node. Since Elestio does not automatically redistribute or migrate workloads during node removal, you should ensure that critical services are either no longer in use or can be manually rescheduled to other nodes in the cluster. This is particularly important in multi-node environments running stateful applications, databases, or services with specific affinity rules.
You should also verify that your cluster will have sufficient capacity after the node is removed. If the deleted node was handling a significant portion of traffic or compute load, removing it without replacement may lead to performance degradation or service interruption. In high-availability clusters, ensure that quorum-based components or replicas are not depending on the node targeted for deletion. Additionally, confirm that the node is not playing a special role such as holding primary data or acting as a manually promoted leader before removal. If necessary, reconfigure or promote another node prior to deletion to maintain cluster integrity.
Backups and Restores
Reliable backups are essential for data resilience, recovery, and business continuity. Elestio provides built-in support for managing backups across all supported services, ensuring that your data is protected against accidental loss, corruption, or infrastructure failure. The platform includes an automated backup system with configurable retention policies and a straightforward restore process, all accessible from the dashboard. Whether you’re operating a production database or a test environment, understanding how backups and restores work in Elestio is critical for maintaining service reliability.
Cluster Backups
Elestio provides multiple backup mechanisms designed to support various recovery and compliance needs. Backups are created automatically for most supported services, with consistent intervals and secure storage in managed infrastructure. These backups are performed in the background to ensure minimal performance impact and no downtime during the snapshot process. Each backup is timestamped, versioned, and stored securely with encryption. You can access your full backup history for any given service through the dashboard and select any version for restoration.
You can utilize different backup options depending on your preferences and operational requirements. Elestio supports manual local backups for on-demand recovery points, automated snapshots that capture the state of the service at fixed intervals, and automated remote backups using Borg, which securely stores backups on external storage volumes managed by Elestio. In addition, you can configure automated external backups to S3-compatible storage, allowing you to maintain full control over long-term retention and geographic storage preferences.
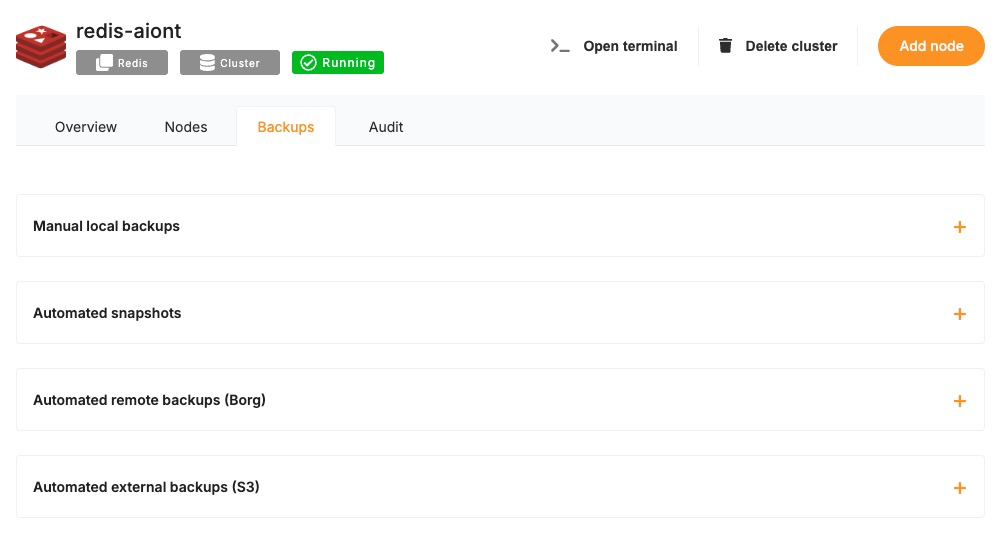
Restoring from a Backup
Restoring a backup in Elestio is a user-initiated operation, available directly from the service dashboard. Once you’re in the dashboard, select the service you’d like to restore. Navigate to the Backups section, where you’ll find a list of all available backups along with their creation timestamps.
To initiate a restore, choose the desired backup version and click on the “Restore” option. You will be prompted to confirm the operation. Depending on the type of service, the restore can either overwrite the current state or recreate the service as a new instance from the selected backup.
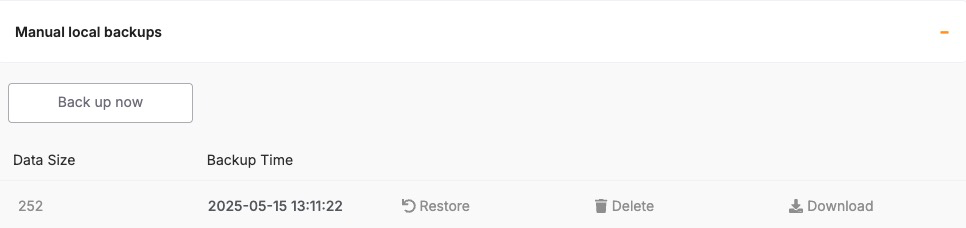
The restore process takes a few minutes, depending on the size of the backup and the service type. Once completed, the restored service is immediately accessible. In the case of databases, you can validate the restore by connecting to the database and inspecting the restored data.
Considerations for Backup & Restore
- Before restoring a backup, it’s important to understand the impact on your current data. Restores may overwrite existing service state, so if you need to preserve the current environment, consider creating a manual backup before initiating the restore. In critical environments, restoring to a new instance and validating the data before replacing the original is a safer approach.
- Keep in mind that restore operations are not instantaneous and may temporarily affect service availability. It’s best to plan restores during maintenance windows or periods of low traffic, especially in production environments.
- For services with high-frequency data changes, be aware of the backup schedule and retention policy. Elestio’s default intervals may not capture every change, so for high-volume databases, consider exporting incremental backups manually or using continuous replication where supported.
Monitoring Backup Health
Elestio provides visibility into your backup history directly through the dashboard. You can monitor the status, timestamps, and success/failure of backup jobs. In case of errors or failed backups, the dashboard will display alerts, allowing you to take corrective actions or contact support if necessary.
It’s good practice to periodically verify that backups are being generated and that restore points are recent and complete. This ensures you’re prepared for unexpected failures and that recovery options remain reliable.
Cluster Resynchronization
In distributed systems, consistency and synchronization between nodes are critical to ensure that services behave reliably and that data remains accurate across the cluster. Elestio provides built-in mechanisms to detect and resolve inconsistencies across nodes using a feature called Cluster Resynchronization. This functionality ensures that node-level configurations, data replication, and service states are properly aligned, especially after issues like node recovery, temporary network splits, or service restarts.
Need for Cluster Resynchronization
Resynchronization is typically required when secondary nodes in a cluster are no longer consistent with the primary node. This can happen due to temporary network failures, node restarts, replication lag, or partial service interruptions. In such cases, secondary nodes may fall behind or store incomplete datasets, which could lead to incorrect behavior if a failover occurs or if read operations are directed to those nodes. Unresolved inconsistencies can result in data divergence, serving outdated content, or failing health checks in load-balanced environments. Performing a resynchronization ensures that all secondary nodes are forcibly aligned with the current state of the primary node, restoring a clean and unified cluster state.
It may also be necessary to perform a resync after restoring a service from backup, during infrastructure migrations, or after recovering a previously offline node. In each of these cases, resynchronization acts as a corrective mechanism to ensure that every node is operating with the same configuration and dataset, reducing the risk of drift and maintaining data integrity across the cluster.
Cluster Resynchronization
To perform a resynchronization, start by accessing the Elestio dashboard and navigating to the Clusters section. Select the cluster where synchronization is needed. On the Cluster Overview page, scroll down slightly until you find the “Resync Cluster” option. This option is visible as part of the cluster controls and is available only in clusters with multiple nodes and a defined primary node.
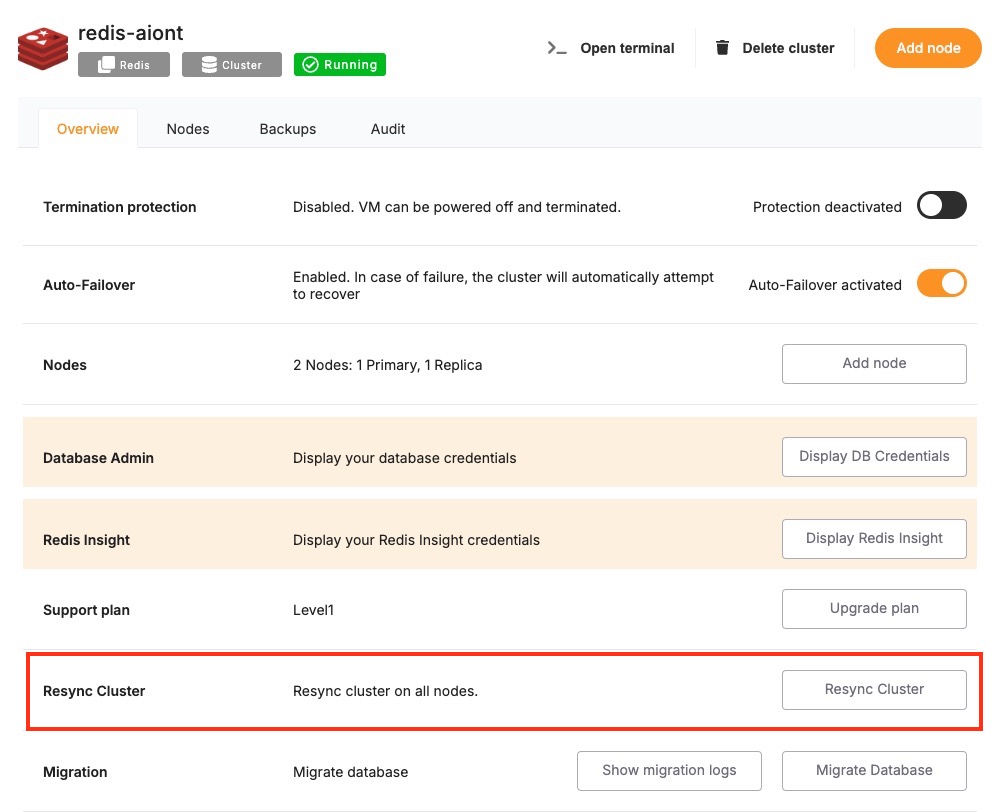
Clicking the Resync button opens a confirmation dialog. The message clearly explains that this action will initiate a request to resynchronize all secondary nodes. During the resync process, existing data on all secondary nodes will be erased and replaced with a copy of the data from the primary node. This operation ensures full consistency across the cluster but should be executed with caution, especially if recent changes exist on any of the secondaries that haven’t yet been replicated.
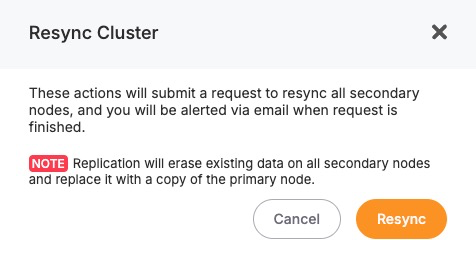
You will receive an email notification once the resynchronization is complete. During this process, Elestio manages the replication safely, but depending on the size of the data, the operation may take a few minutes. It’s advised to avoid making further changes to the cluster while the resync is in progress.
Considerations Before Resynchronizing
- Before triggering a resync, it’s important to verify that the primary node holds the desired state and that the secondary nodes do not contain any critical unsynced data. Since the resync overwrites the secondary nodes completely, any local changes on those nodes will be lost.
- This action is best used when you’re confident that the primary node is healthy, current, and stable. Avoid initiating a resync if the primary has recently experienced errors or data issues. Additionally, consider performing this operation during a low-traffic period, as synchronization may temporarily impact performance depending on the data volume.
- If your application requires high consistency guarantees, it’s recommended to monitor your cluster closely during and after the resync to confirm that services are functioning correctly and that the replication process completed successfully.
Database Migrations
When managing production-grade services, the ability to perform reliable and repeatable database migrations is critical. Whether you’re applying schema changes, updating seed data, or managing version-controlled transitions, Elestio provides a built-in mechanism to execute migrations safely from the dashboard. This functionality is especially relevant when running containerized database services like Redis, or similar within a managed cluster.
Need for Migrations
Database migrations are commonly required when updating your application’s data model or deploying new features. Schema updates such as adding columns, modifying data types, creating indexes, or introducing new tables need to be synchronized with the deployment lifecycle of your application code.
Migrations may also be needed during version upgrades to introduce structural or configuration changes required by newer database engine versions. In some cases, teams use migrations to apply baseline datasets, adjust permissions, or clean up legacy objects. Running these changes through a controlled migration system ensures consistency across environments and helps avoid untracked manual changes.
Running Database Migration
To run a database migration in Elestio, start by logging into the Elestio dashboard and navigating to the Clusters section. Select the cluster that contains the target database service. From the Cluster Overview page, scroll down until you find the “Migration” option.
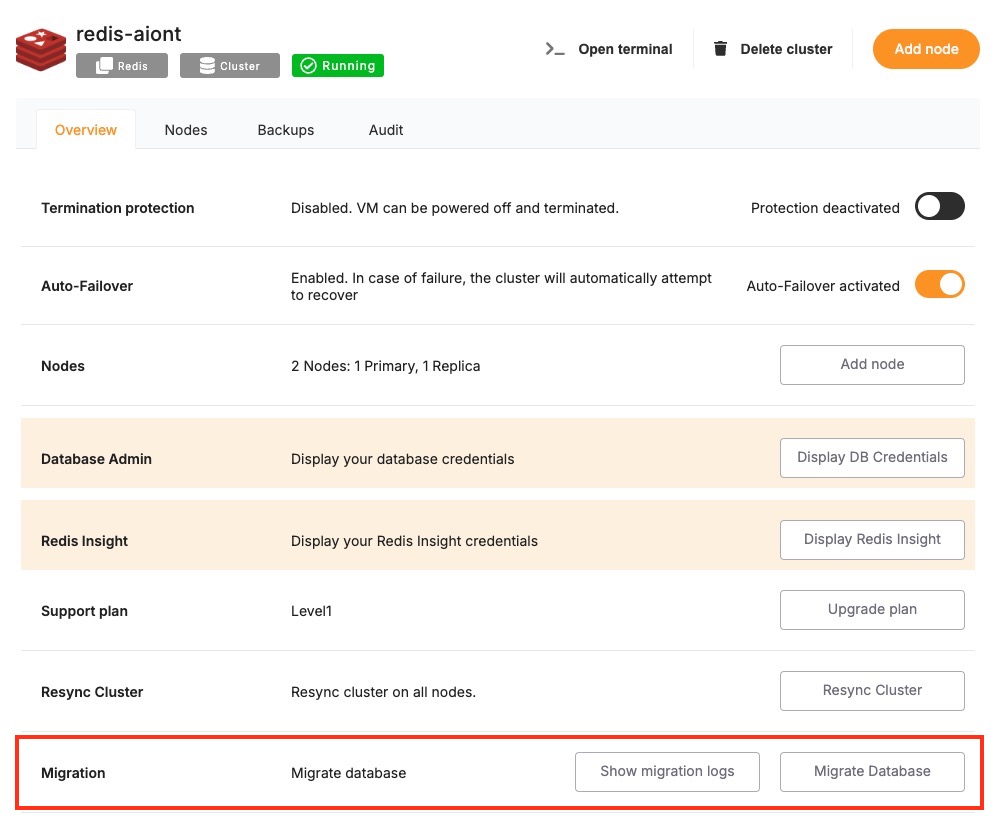
Clicking this option will open the migration workflow, which follows a three-step process: Configure, Validation, and Migration. In the Configure step, Elestio provides a migration configuration guide specific to the database type, such as Redis. At this point, you must ensure that your target service has sufficient disk space to complete the migration. If there is not enough storage available, the migration may fail midway, so it’s strongly recommended to review storage utilization beforehand.
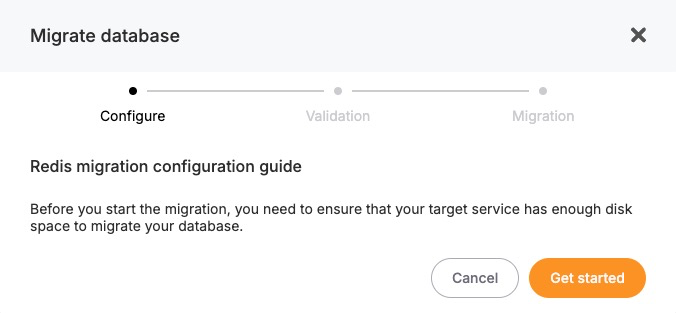
Once configuration prerequisites are met, you can proceed to the Validation step. Elestio will check the secondary database details you have provided for the migration.
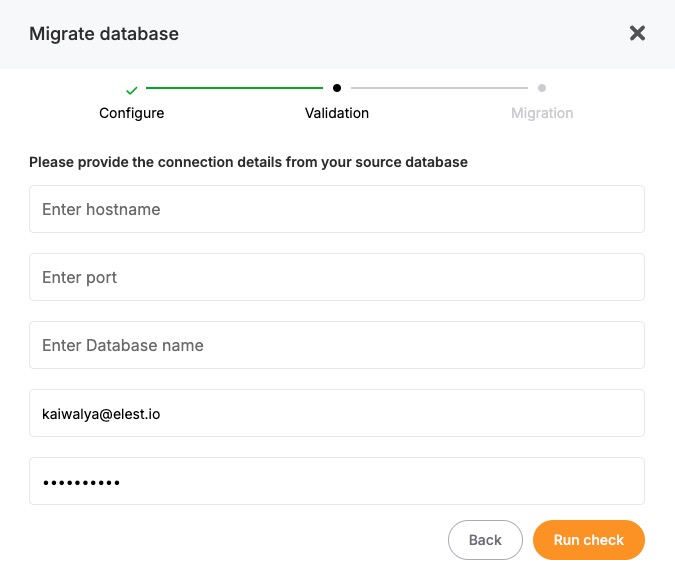
If the validation passes, the final Migration step will become active. You can then initiate the migration process. Elestio will handle the actual data transfer, schema replication, and state synchronization internally. The progress is tracked, and once completed, the migrated database will be fully operational on the target service.
Considerations Before Running Migrations
- Before running any migration, it’s important to validate the script or changes in a staging environment. Since migrations may involve irreversible changes—such as dropping columns, altering constraints, or modifying data—careful review and version control are essential.
- In production environments, plan migrations during maintenance windows or low-traffic periods to minimize the impact of any schema locks or temporary unavailability. If you’re using replication or high-availability setups, confirm that the migration is compatible with your architecture and will not disrupt synchronization between primary and secondary nodes.
- You should also ensure that proper backups are in place before applying structural changes. In Elestio, the backup feature can be used to create a restore point that allows rollback in case the migration introduces issues.
Delete a Cluster
When a cluster is no longer needed whether it was created for testing, staging, or an obsolete workload—deleting it helps free up resources and maintain a clean infrastructure footprint. Elestio provides a straightforward and secure way to delete entire clusters directly from the dashboard. This action permanently removes the associated services, data, and compute resources tied to the cluster.
When to Delete a Cluster
Deleting a cluster is a final step often performed when decommissioning an environment. This could include shutting down a test setup, replacing infrastructure during migration, or retiring an unused production instance. In some cases, users also delete and recreate clusters as part of major version upgrades or architectural changes. It is essential to confirm that all data and services tied to the cluster are no longer required or have been backed up or migrated before proceeding. Since cluster deletion is irreversible, any services, volumes, and backups associated with the cluster will be permanently removed.
Delete a Cluster
To delete a cluster, log in to the Elestio dashboard and navigate to the Clusters section. From the list of clusters, select the one you want to remove. Inside the selected cluster, you’ll find a navigation bar at the top of the page. One of the available options in this navigation bar is “Delete Cluster.”
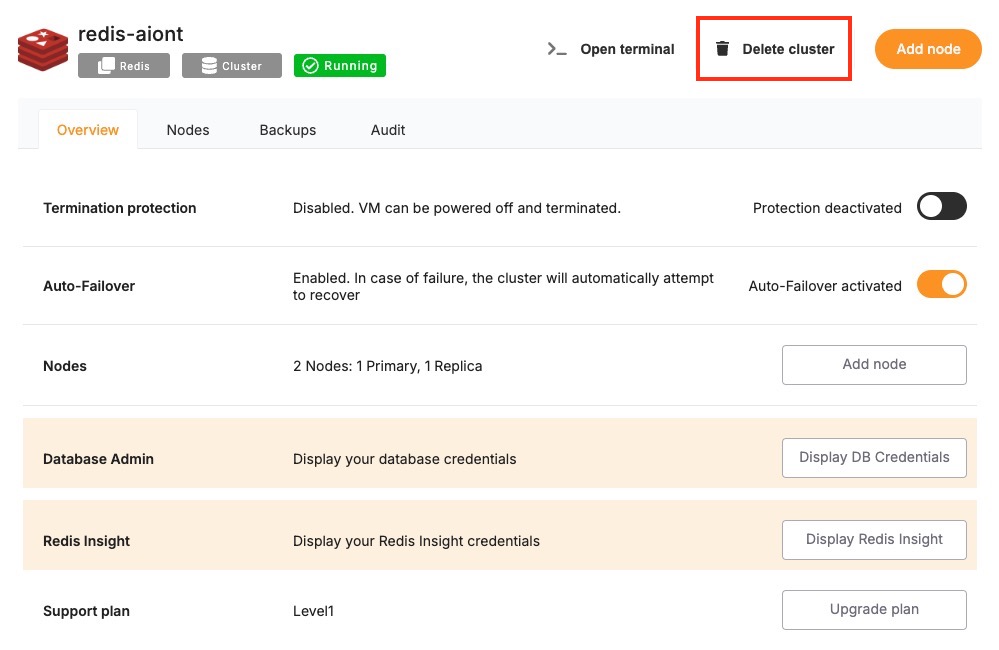
Clicking this opens a confirmation dialog that outlines the impact of deletion. It will clearly state that deleting the cluster will permanently remove all associated services, storage, and configurations. By acknowledging a warning or typing in the cluster name, depending on the service type. Once confirmed, Elestio will initiate the deletion process, which includes tearing down all resources associated with the cluster. This typically completes within a few minutes, after which the cluster will no longer appear in your dashboard.
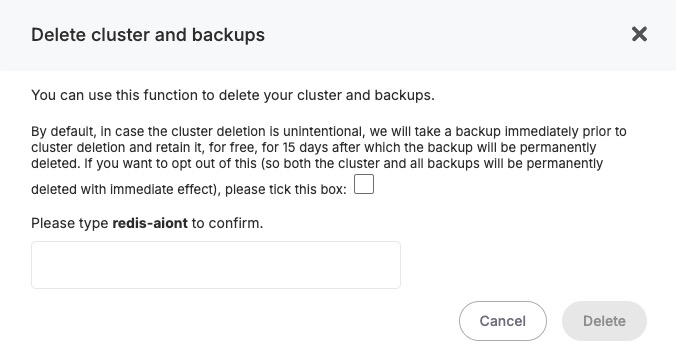
Considerations Before Deleting
Deleting a cluster also terminates any linked domains, volumes, monitoring configurations, and scheduled backups. These cannot be recovered once deletion is complete, so plan accordingly before confirming the action. If the cluster was used for production workloads, consider archiving data to external storage (e.g., S3) or exporting final snapshots for compliance and recovery purposes.
Before deleting a cluster, verify that:
-
All required data has been backed up externally (e.g., downloaded dumps or exports).
-
Any active services or dependencies tied to the cluster have been reconfigured or shut down.
-
Access credentials, logs, or stored configuration settings have been retrieved if needed for auditing or migration.
Restricting Access by IP
Securing access to services is a fundamental part of managing cloud infrastructure. One of the most effective ways to reduce unauthorized access is by restricting connectivity to a defined set of IP addresses. Elestio supports IP-based access control through its dashboard, allowing you to explicitly define which IPs or IP ranges are allowed to interact with your services. This is particularly useful when exposing databases, APIs, or web services over public endpoints.
Need to Restrict Access by IP
Restricting access by IP provides a first layer of network-level protection. Instead of relying solely on application-layer authentication, you can control who is allowed to even initiate a connection to your service. This approach reduces the surface area for attacks such as brute-force login attempts, automated scanning, or unauthorized probing.
Common use cases include:
-
Limiting access to production databases from known office networks or VPNs.
-
Allowing only CI/CD pipelines or monitoring tools with static IPs to connect.
-
Restricting admin dashboards or internal tools to internal teams.
By defining access rules at the infrastructure level, you gain more control over who can reach your services, regardless of their authentication or API access status.
Restrict Access by IP
To restrict access by IP in Elestio, start by logging into the Elestio dashboard and navigating to the Clusters section. Select the cluster that hosts the service you want to protect. Once inside the Cluster Overview page, locate the Security section.
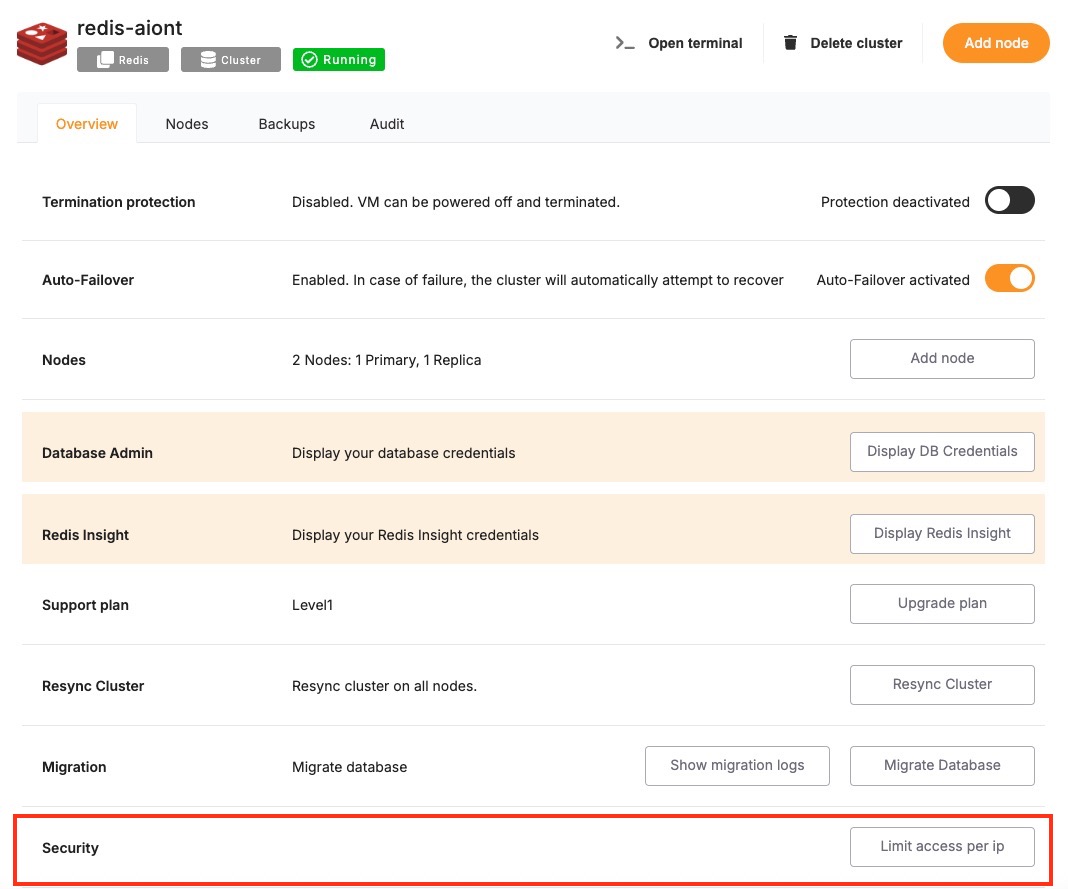
Within this section, you’ll find a setting labeled “Limit access per IP”. This is where you can define which IP addresses or CIDR ranges are permitted to access the services running in the cluster. You can add a specific IPv4 or IPv6 address (e.g., 203.0.113.5) or a subnet in CIDR notation (e.g., 203.0.113.0/24) to allow access from a range of IPs.
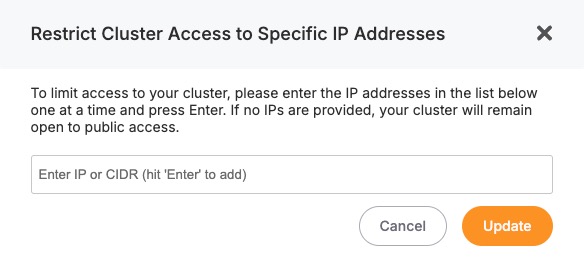
After entering the necessary IP addresses, save the configuration. The changes will apply to all services running inside the cluster, and only the defined IPs will be allowed to establish network connections. All other incoming requests from unlisted IPs will be blocked at the infrastructure level.
Considerations When Using IP Restrictions
- When applying IP restrictions, it’s important to avoid locking yourself out. Always double-check that your own IP address is included in the allowlist before applying rules, especially when working on remote infrastructure.
- For users on dynamic IPs (e.g., home broadband connections), consider using a VPN or a static jump host that you can reliably allowlist. Similarly, if your services are accessed through cloud-based tools, make sure to verify their IP ranges and update your rules accordingly when those IPs change.
- In multi-team environments, document and review IP access policies regularly to avoid stale rules or overly permissive configurations. Combine IP restrictions with secure authentication and encrypted connections (such as HTTPS or SSL for databases) for layered security.