
Metrics Live & Historical
Live Metrics
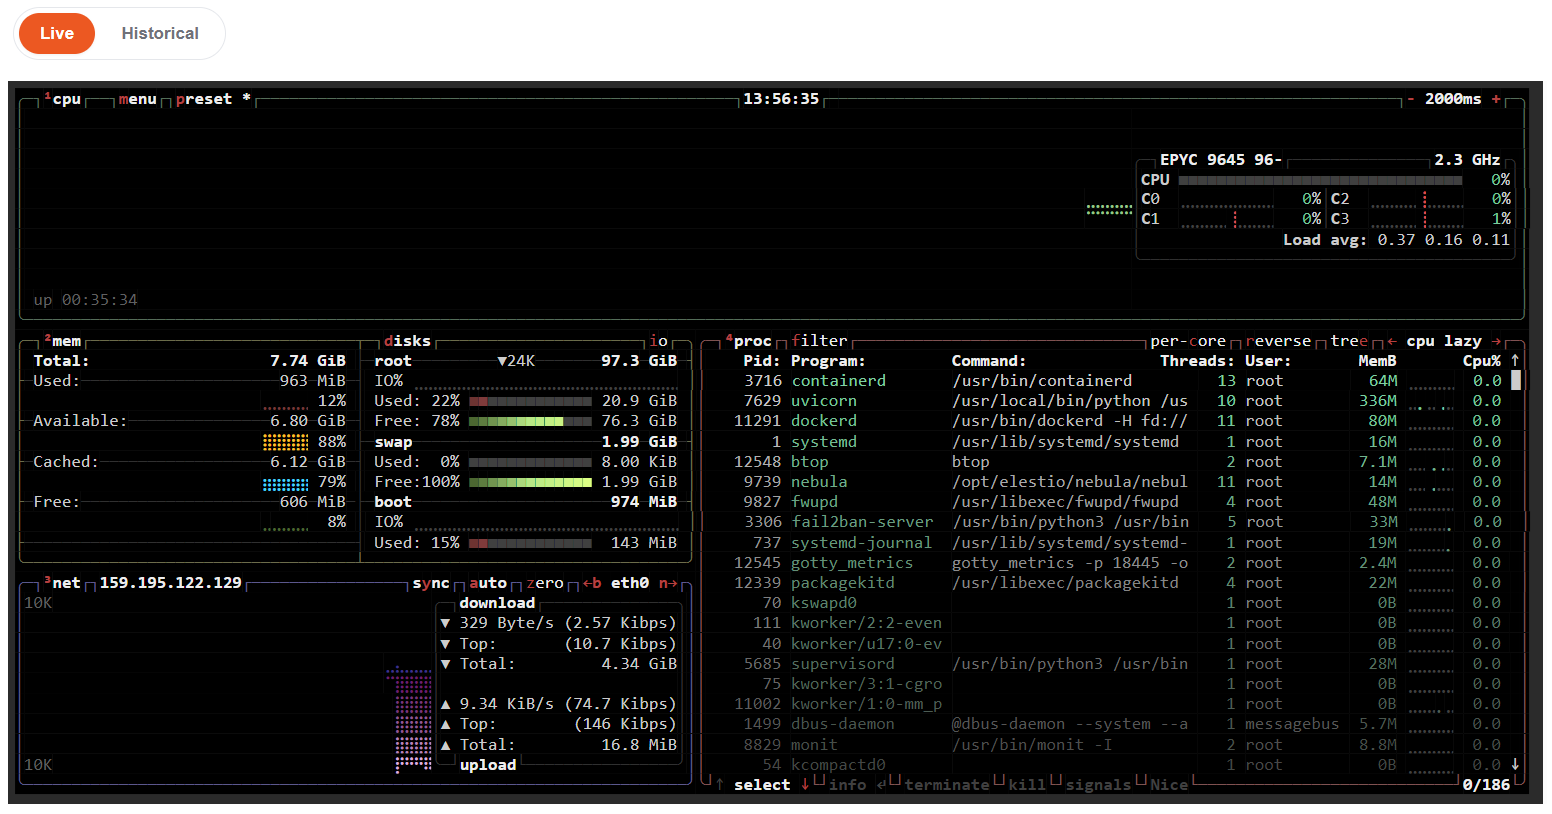
Live metrics give you a real-time view of your server's performance. This mode streams data directly to your dashboard, allowing you to observe CPU usage, memory consumption, network activity, and disk operations as they happen. It's ideal for debugging issues in the moment or keeping an eye on a deployment in progress.
Historical Metrics
Historical metrics let you look back at your server's performance over a chosen time range, 6 hours, 24 hours, 7 days, or 31 days. The following charts are available:
- CPU Usage: Processor utilization over time
- Memory Usage: RAM consumption over time
- Disk I/O: Read and write throughput (KB/s)
- Network Bytes: Inbound and outbound data transfer
- Network Packets: Inbound and outbound packets per second.
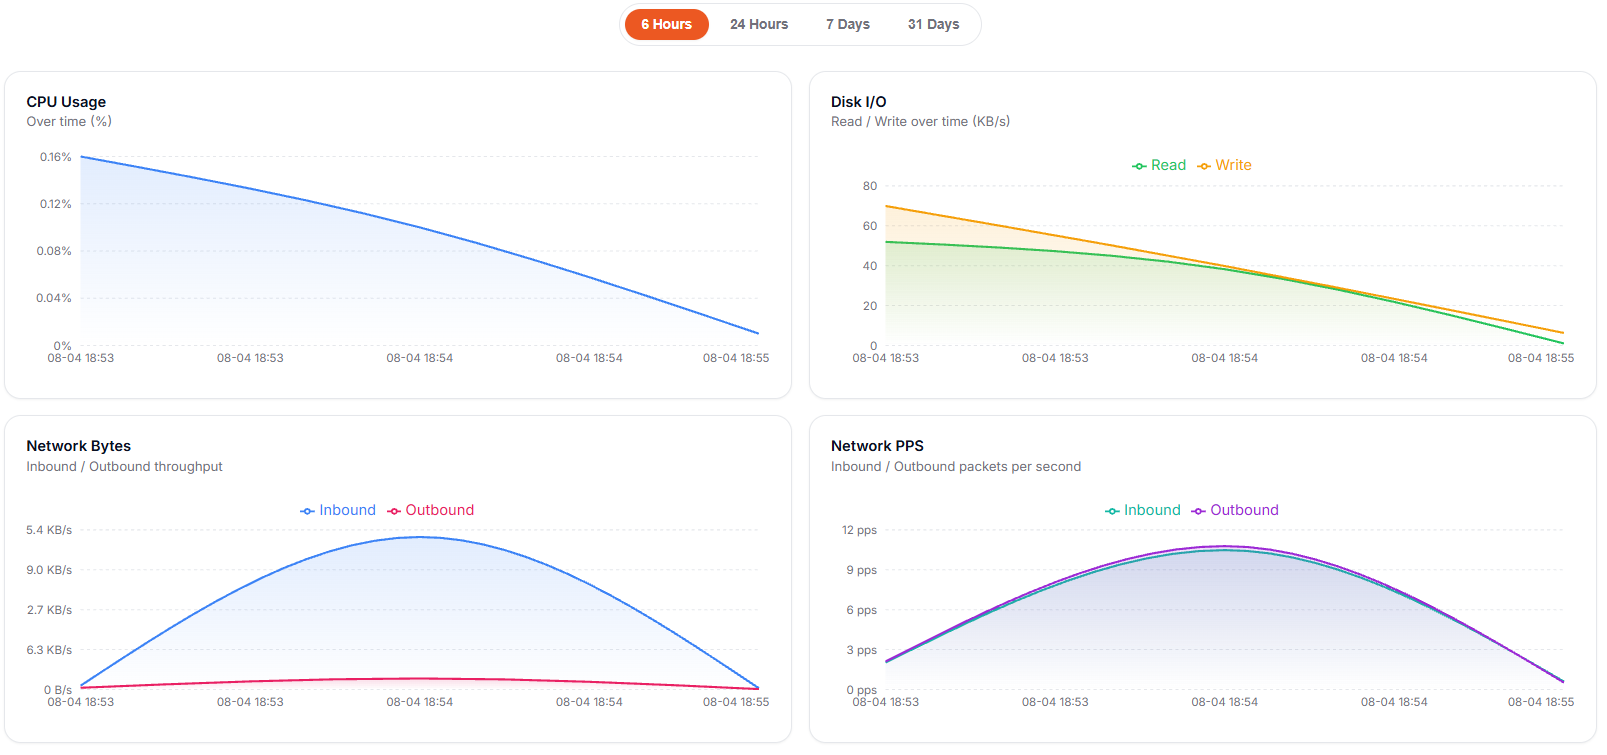
You can switch between Live and Historical modes using the toggle at the top of the Metrics tab.
Provider Notes
Metric availability may vary depending on your cloud provider. For example, Vultr only exposes bandwidth data through its API. CPU, memory, and disk metrics are not available. Vultr's bandwidth data is also updated periodically and grouped by full UTC calendar day, so recent intervals may take some time to appear, and scaleway only supported live metrics, not historical.