
Identifying Slow Queries
Slow queries can impact ClickHouse performance, especially under high load or with inefficient queries or schema design. Whether you’re using ClickHouse on Elestio via the dashboard, accessing it inside a Docker Compose container, or running CLI queries, ClickHouse offers built-in tools to detect, diagnose, and optimize performance bottlenecks. This guide explains how to capture slow queries using system tables, measure query latency, and improve performance through tuning and query optimization.
Inspecting Slow Queries from the Terminal
ClickHouse logs query profiling information by default, which you can access via system tables. This allows you to identify long-running or resource-intensive queries directly from SQL.
Connect to ClickHouse via Terminal
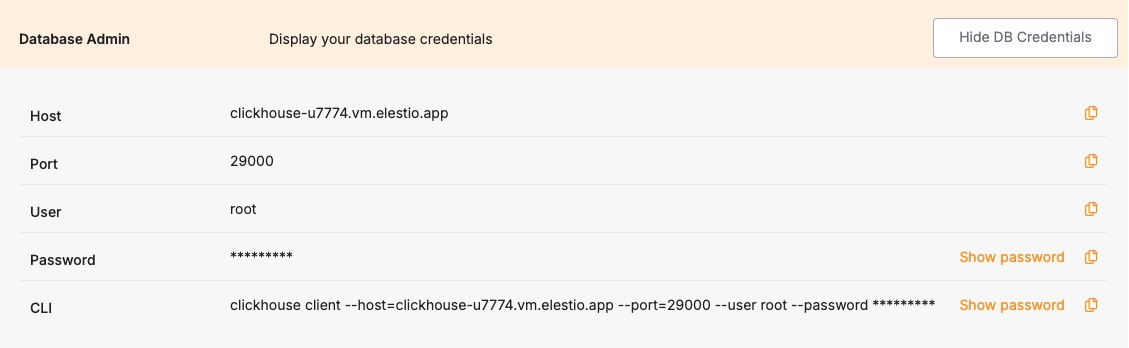
Use the ClickHouse client to connect to your instance:
clickhouse-client -h <host> --port <port> --user <username> --password <password>Replace <host>, <port>, <username>, and <password> with your credentials from the Elestio dashboard.
View Recent Slow Queries
ClickHouse logs query performance stats in the system.query_log table. To view the 10 most recent queries that took longer than 1 second:
SELECT
  query_start_time,
  query_duration_ms,
  query
FROM system.query_log
WHERE type = 'QueryFinish'
  AND query_duration_ms > 1000
ORDER BY query_start_time DESC
LIMIT 10;
You can adjust the query_duration_ms threshold to capture slower or more critical queries.
Analyzing Inside Docker Compose
If your ClickHouse instance is running inside Docker Compose, you can inspect query logs and system performance from inside the container.
Access the ClickHouse Container
Open a shell session inside the running container:
docker-compose exec clickhouse bashThen run the ClickHouse client:
clickhouse-client --user rootIf a password is required, append --password <yourpassword> to the command.
Query the system.query_log Inside the Container
Run the same slow query inspection SQL as above to analyze performance issues:
SELECT query_start_time, query_duration_ms, query
FROM system.query_log
WHERE type = 'QueryFinish' AND query_duration_ms > 1000
ORDER BY query_start_time DESC
LIMIT 10;
Using the System Metrics & Events Tables
ClickHouse includes system tables that expose performance-related metrics in real time.
Check Overall Query Performance
You can use the system.metrics table to view metrics like query execution time, memory usage, and background operations:
SELECT *
FROM system.metrics
WHERE value != 0
ORDER BY value DESC;
For cumulative statistics like total queries processed, check the system.events table:
SELECT *
FROM system.events
WHERE value > 0
ORDER BY value DESC;
Understanding and Resolving Common Bottlenecks
Slow performance in ClickHouse is often caused by suboptimal queries, improper indexing (i.e., no primary key usage), disk I/O, or high memory usage.
Common Causes of Slow Queries:
-
Large table scans: Caused by missing filtering conditions or lack of primary key usage.
-
JOINs on unindexed keys: Inefficient joins can result in full-table scans.
-
High cardinality aggregations: Especially costly without optimization (e.g., using uniqExact()).
-
High insert latency: Triggered by too frequent small batch writes.
-
Disk bottlenecks: Heavy merges or large result sets can overload I/O.
Best Practices to Avoid Slow Queries:
-
Use appropriate filtering: Always filter with indexed columns (usually primary keys).
-
Avoid SELECT *: Specify only the needed columns.
-
Use sampling when possible: ClickHouse supports SAMPLE clause on MergeTree tables.
-
Use LIMIT: Avoid returning large result sets when debugging.
-
Optimize JOINs: Prefer ANY INNER JOIN or JOIN ... USING for performance.
Optimizing with Configuration Changes
ClickHouse performance can be tuned via its configuration files (config.xml and users.xml) or environment variables. For Docker Compose setups, these can be overridden via docker-compose.override.yml.
Adjust Query and Memory Settings Dynamically
Some performance-related settings can be changed per session or globally:
SET max_memory_usage = 2000000000;
SET max_threads = 4;
SET log_queries = 1;
To make permanent changes, modify your config.xml or users.xml inside the container volume mount.