Monitoring
Track your service in real time, get alerted on resource limits, and keep notes for your team.
Metrics
The Metrics tab shows your service metrics in real time. You can set the refresh interval as low as 1 second.
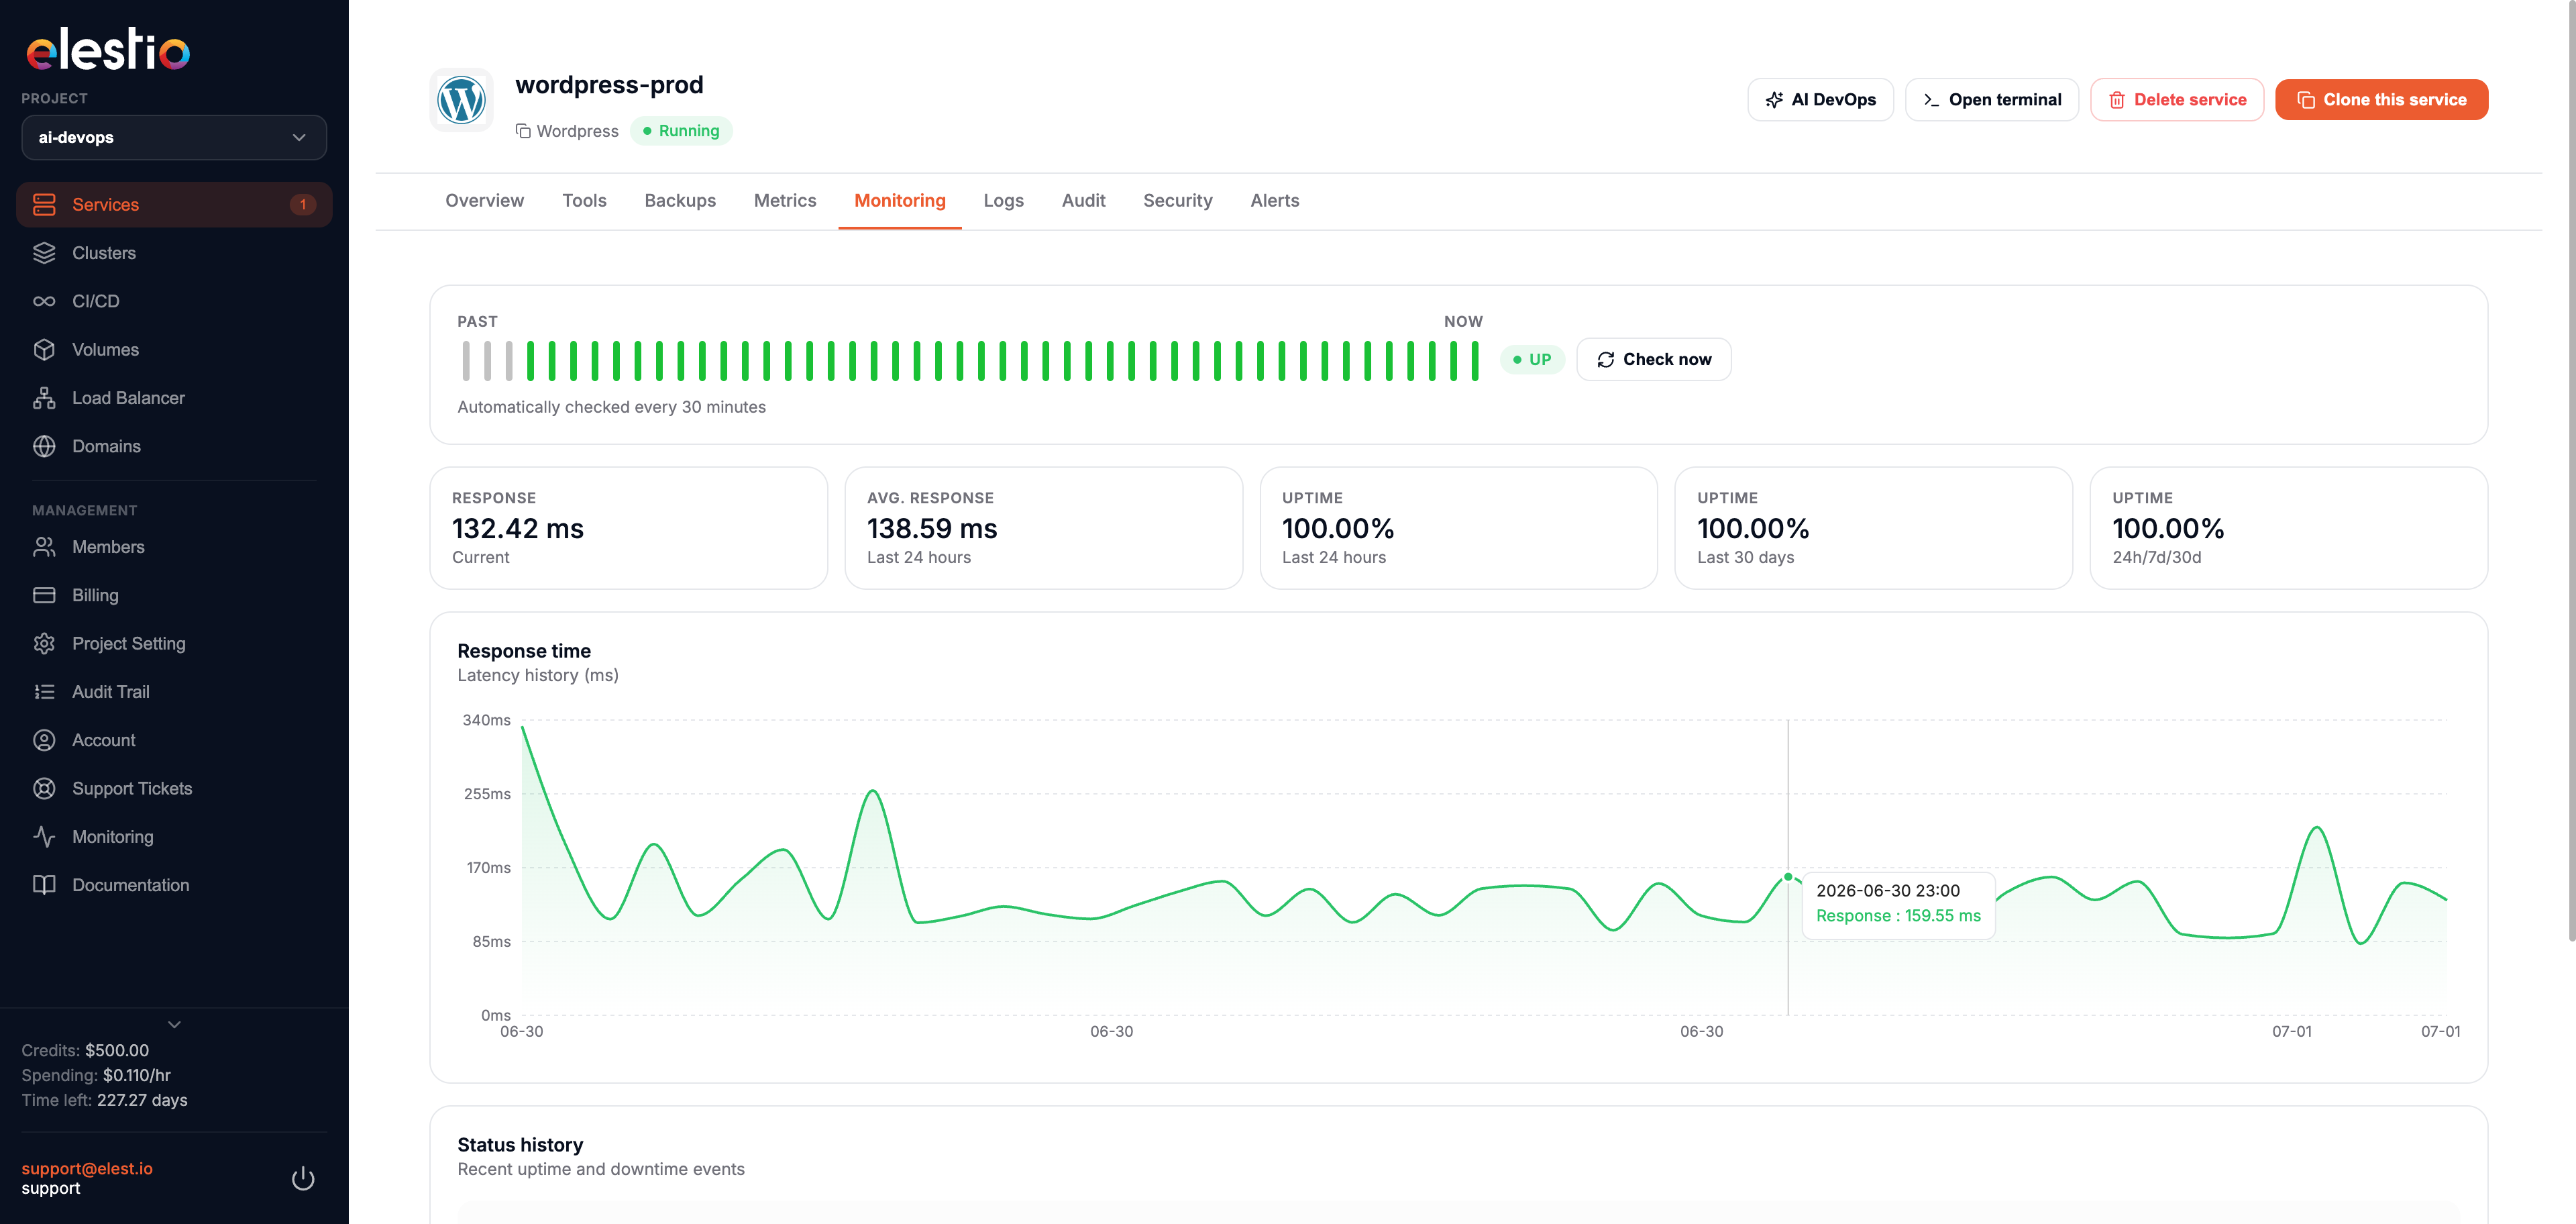
Real-time metrics use extra CPU while the dashboard is open. To limit usage, increase the refresh interval or select fewer metrics.
Alerts
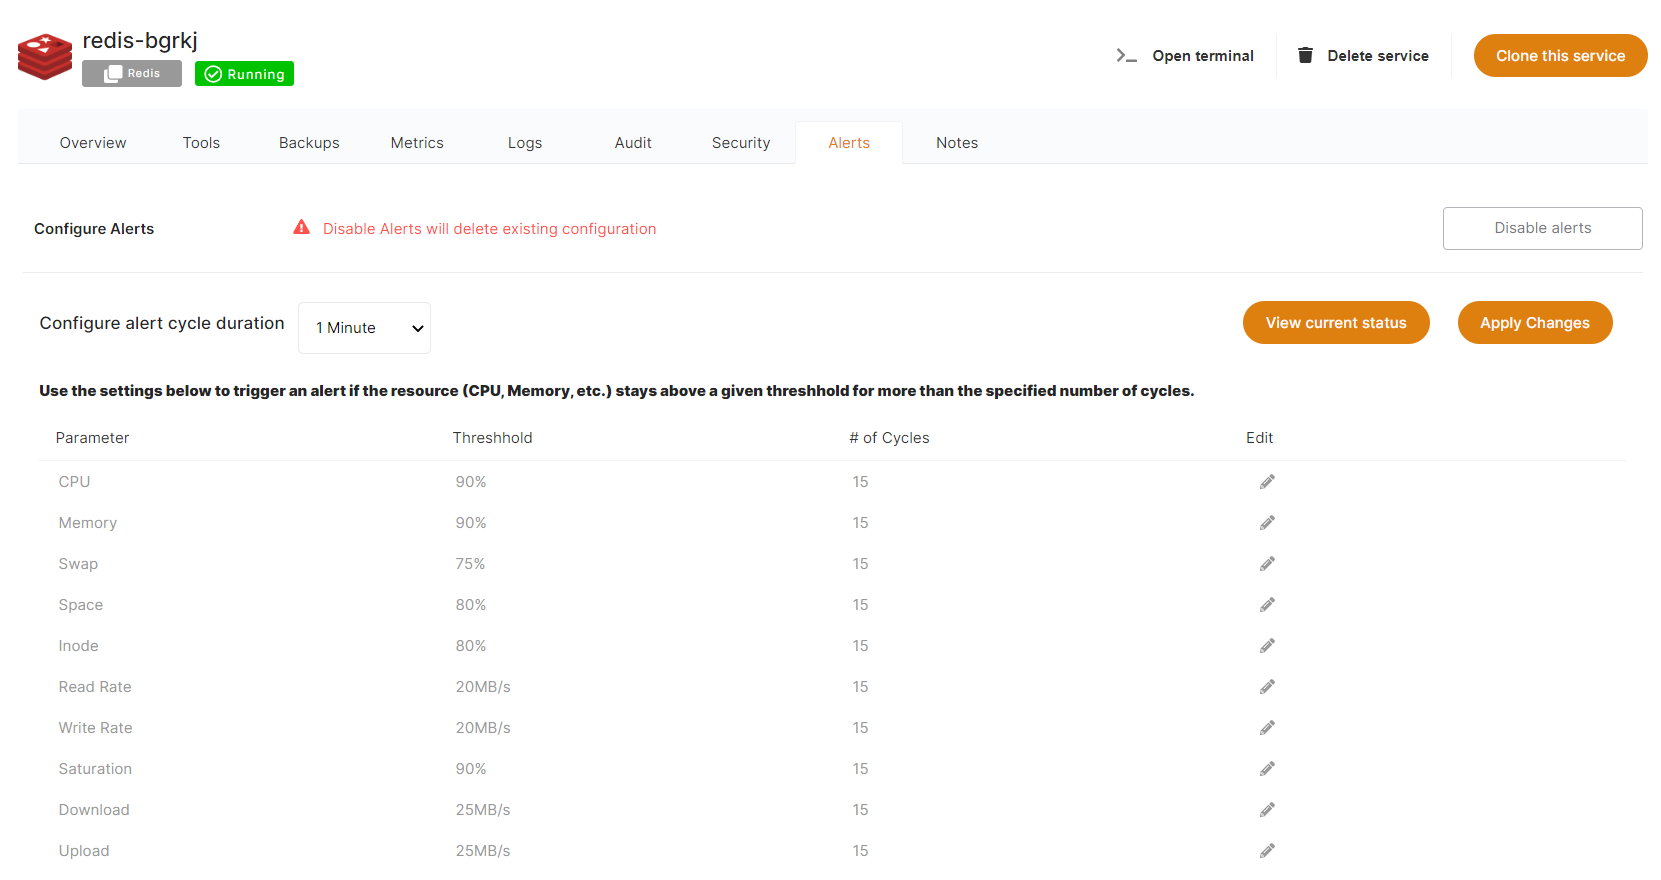
Alerts are enabled by default on every new service.
Enable or disable alerts and set usage limits per resource. The default cycle is 1 minute, and you can require a number of cycles over the limit before an alert fires. Alerts are emailed to the server owner on file.
Notes
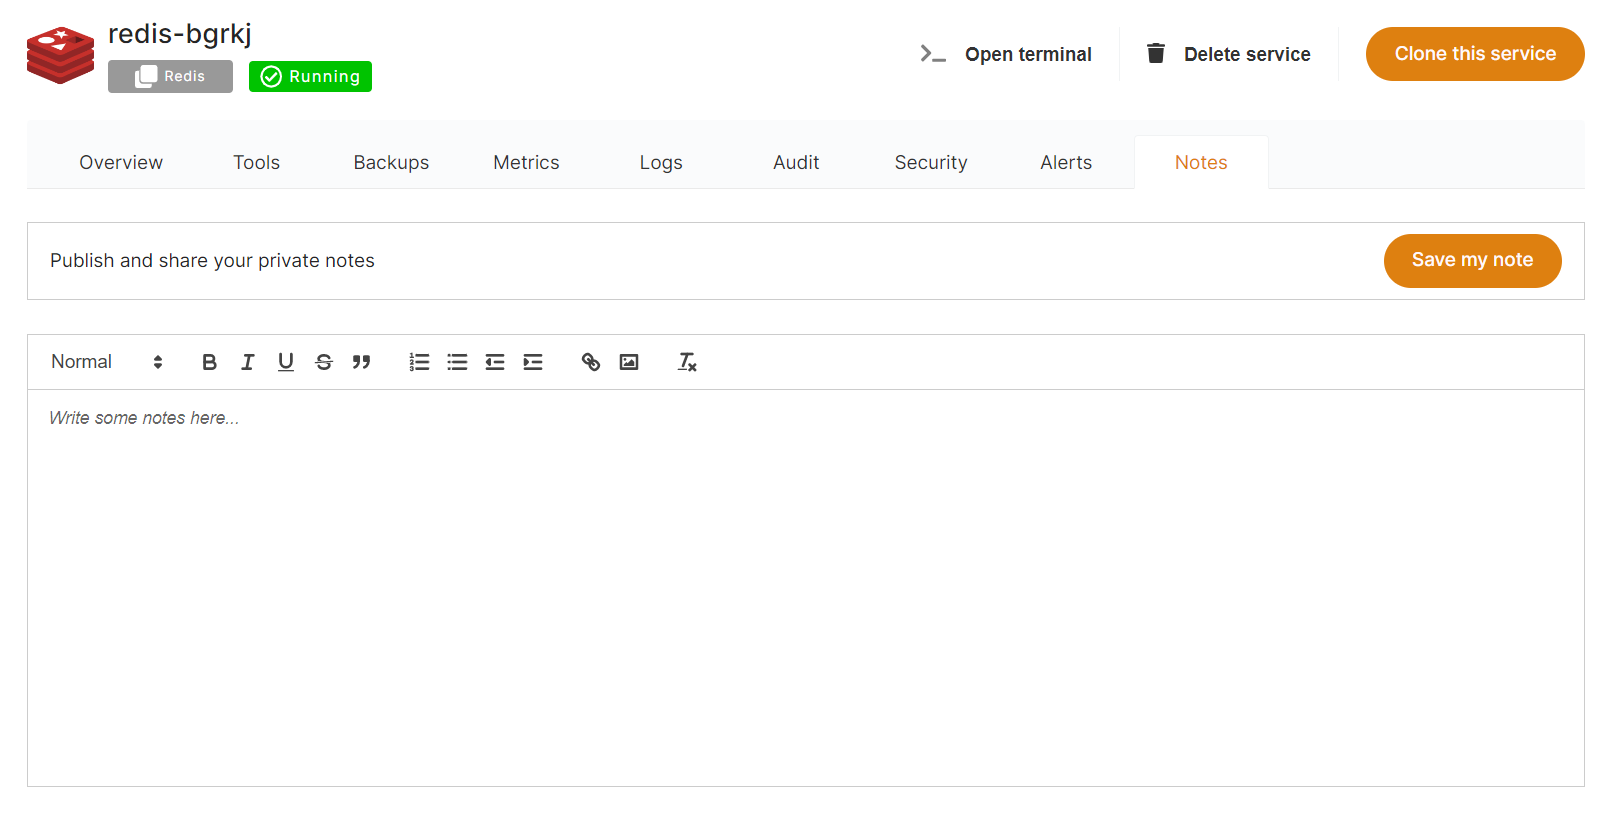
The Notes tab stores text notes about a service, for yourself or your team.
Backups
Backups have their own section. See the backups documentation for full details.